Financial guarantees given (Medium-sized banks) - ekonomika ČNB
Aktualizace dat Financial guarantees given (Medium-sized banks) v této aplikaci skončila 30.6.2023. Aktualizovná data časových řad najdete na stránkách nové aplikace z dat ARAD ČNB
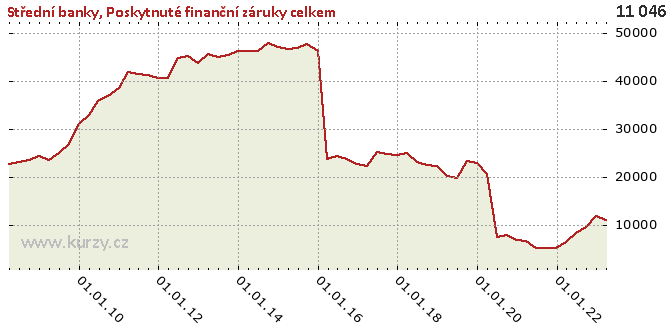
Graf hodnot, Medium-sized banks
Meziroční srovnání
Minima a maxima
| Typ | Období | Hodnota |
|---|---|---|
| Min | 30.06.2019 | 19 852.00 |
| Max | 30.09.2014 | 48 089.00 |
Historické hodnoty
| Období | Hodnota | Předchozí | Rozdíl | Změna | Před rokem | Rozdíl | Změna |
|---|---|---|---|---|---|---|---|
| 31.03.2020 | 20 807.00 | 22 905.00 | -2 098.00 | -9.16% | 20 238.00 | 569.00 | 2.81% |
| 31.12.2019 | 22 905.00 | 23 517.00 | - 612.00 | -2.60% | 22 418.00 | 487.00 | 2.17% |
| 30.09.2019 | 23 517.00 | 19 852.00 | 3 665.00 | 18.46% | 22 567.00 | 950.00 | 4.21% |
| 30.06.2019 | 19 852.00 | 20 238.00 | - 386.00 | -1.91% | 23 276.00 | -3 424.00 | -14.71% |
| 31.03.2019 | 20 238.00 | 22 418.00 | -2 180.00 | -9.72% | 25 008.00 | -4 770.00 | -19.07% |
| 31.12.2018 | 22 418.00 | 22 567.00 | - 149.00 | -0.66% | 24 702.00 | -2 284.00 | -9.25% |
| 30.09.2018 | 22 567.00 | 23 276.00 | - 709.00 | -3.05% | 24 955.00 | -2 388.00 | -9.57% |
| 30.06.2018 | 23 276.00 | 25 008.00 | -1 732.00 | -6.93% | 25 311.00 | -2 035.00 | -8.04% |
| 31.03.2018 | 25 008.00 | 24 702.00 | 306.00 | 1.24% | 22 292.00 | 2 716.00 | 12.18% |
| 31.12.2017 | 24 702.00 | 24 955.00 | - 253.00 | -1.01% | 22 829.00 | 1 873.00 | 8.20% |
| 30.09.2017 | 24 955.00 | 25 311.00 | - 356.00 | -1.41% | 23 769.00 | 1 186.00 | 4.99% |
| 30.06.2017 | 25 311.00 | 22 292.00 | 3 019.00 | 13.54% | 24 566.00 | 745.00 | 3.03% |
| 31.03.2017 | 22 292.00 | 22 829.00 | - 537.00 | -2.35% | 23 898.00 | -1 606.00 | -6.72% |
| 31.12.2016 | 22 829.00 | 23 769.00 | - 940.00 | -3.95% | 46 431.00 | -23 602.00 | -50.83% |
| 30.09.2016 | 23 769.00 | 24 566.00 | - 797.00 | -3.24% | 47 720.00 | -23 951.00 | -50.19% |
| 30.06.2016 | 24 566.00 | 23 898.00 | 668.00 | 2.80% | 46 874.00 | -22 308.00 | -47.59% |
| 31.03.2016 | 23 898.00 | 46 431.00 | -22 533.00 | -48.53% | 46 666.00 | -22 768.00 | -48.79% |
| 31.12.2015 | 46 431.00 | 47 720.00 | -1 289.00 | -2.70% | 47 263.00 | - 832.00 | -1.76% |
| 30.09.2015 | 47 720.00 | 46 874.00 | 846.00 | 1.80% | 48 089.00 | - 369.00 | -0.77% |
| 30.06.2015 | 46 874.00 | 46 666.00 | 208.00 | 0.45% | 46 294.00 | 580.00 | 1.25% |
| 31.03.2015 | 46 666.00 | 47 263.00 | - 597.00 | -1.26% | 46 396.00 | 270.00 | 0.58% |
| 31.12.2014 | 47 263.00 | 48 089.00 | - 826.00 | -1.72% | 46 281.00 | 982.00 | 2.12% |
| 30.09.2014 | 48 089.00 | 46 294.00 | 1 795.00 | 3.88% | 45 538.00 | 2 551.00 | 5.60% |
| 30.06.2014 | 46 294.00 | 46 396.00 | - 102.00 | -0.22% | 44 991.00 | 1 303.00 | 2.90% |
| 31.03.2014 | 46 396.00 | 46 281.00 | 115.00 | 0.25% | 45 696.00 | 700.00 | 1.53% |
| 31.12.2013 | 46 281.00 | 45 538.00 | 743.00 | 1.63% | 43 817.00 | 2 464.00 | 5.62% |
| 30.09.2013 | 45 538.00 | 44 991.00 | 547.00 | 1.22% | 45 393.00 | 145.00 | 0.32% |
| 30.06.2013 | 44 991.00 | 45 696.00 | - 705.00 | -1.54% | 44 889.00 | 102.00 | 0.23% |
| 31.03.2013 | 45 696.00 | 43 817.00 | 1 879.00 | 4.29% | 40 731.00 | 4 965.00 | 12.19% |
| 31.12.2012 | 43 817.00 | 45 393.00 | -1 576.00 | -3.47% | 40 646.00 | 3 171.00 | 7.80% |
| 30.09.2012 | 45 393.00 | 44 889.00 | 504.00 | 1.12% | 41 321.00 | 4 072.00 | 9.85% |
| 30.06.2012 | 44 889.00 | 40 731.00 | 4 158.00 | 10.21% | 41 556.00 | 3 333.00 | 8.02% |
| 31.03.2012 | 40 731.00 | 40 646.00 | 85.00 | 0.21% | 41 871.00 | -1 140.00 | -2.72% |
| 31.12.2011 | 40 646.00 | 41 321.00 | - 675.00 | -1.63% | 38 606.00 | 2 040.00 | 5.28% |
| 30.09.2011 | 41 321.00 | 41 556.00 | - 235.00 | -0.57% | 36 976.00 | 4 345.00 | 11.75% |
| 30.06.2011 | 41 556.00 | 41 871.00 | - 315.00 | -0.75% | 36 009.00 | 5 547.00 | 15.40% |
| 31.03.2011 | 41 871.00 | 38 606.00 | 3 265.00 | 8.46% | 33 045.00 | 8 826.00 | 26.71% |
| 31.12.2010 | 38 606.00 | 36 976.00 | 1 630.00 | 4.41% | 31 057.00 | 7 549.00 | 24.31% |
| 30.09.2010 | 36 976.00 | 36 009.00 | 967.00 | 2.69% | 26 956.00 | 10 020.00 | 37.17% |
| 30.06.2010 | 36 009.00 | 33 045.00 | 2 964.00 | 8.97% | 25 075.00 | 10 934.00 | 43.61% |
| 31.03.2010 | 33 045.00 | 31 057.00 | 1 988.00 | 6.40% | 23 623.00 | 9 422.00 | 39.88% |
| 31.12.2009 | 31 057.00 | 26 956.00 | 4 101.00 | 15.21% | 24 517.00 | 6 540.00 | 26.68% |
| 30.09.2009 | 26 956.00 | 25 075.00 | 1 881.00 | 7.50% | 23 622.00 | 3 334.00 | 14.11% |
| 30.06.2009 | 25 075.00 | 23 623.00 | 1 452.00 | 6.15% | 23 276.00 | 1 799.00 | 7.73% |
| 31.03.2009 | 23 623.00 | 24 517.00 | - 894.00 | -3.65% | 22 734.00 | 889.00 | 3.91% |
| 31.12.2008 | 24 517.00 | 23 622.00 | 895.00 | 3.79% | - | - | - |
| 30.09.2008 | 23 622.00 | 23 276.00 | 346.00 | 1.49% | - | - | - |
| 30.06.2008 | 23 276.00 | 22 734.00 | 542.00 | 2.38% | - | - | - |
| 31.03.2008 | 22 734.00 | - | - | - | - | - | - |
Graf jako obrázek

Podobné sestavy
Aplikace Ekonomika ČNB ze sekce makroekonomika zobrazuje časové řady hlavních makroekonomických údajů z ekonomiky ČR. Najdete zde přes 10.000 grafů různých hodnot od úrokových sazeb, přes statistiky státního rozpočtu, statistiky ČNB a data zpracovávaná ČSÚ. Data jsou k dispozici obvykle za posledních více než 20 let, od prosince roku 1992. Zdroj dat: ČNB ARAD

