Products of the chemical industry and related branches - ekonomika ČNB
Aktualizace dat
Products of the chemical industry and related branches v této aplikaci skončila 30.6.2023. Aktualizovná data časových řad najdete na stránkách nové aplikace z dat
ARAD ČNB
Nové časové řady makroekonomiky a jejich data
| Data ke dni | Řada nebo sestava |
|---|
| 31.03.2024 |
Úvěry: Celkové náklady úvěrů domácnostem na bydlení v ČR vyjádřené ukazatelem cost of borrowing, Míra v %, Procenta, Měsíční |
| 29.02.2024 |
Úvěry: Celkove náklady úvěrů domácnostem na bydlení v EA vyjádřené ukazatelem cost of borrowing, Míra v %, Procenta, Měsíční |
| 31.03.2024 |
Úvěry: Celkové náklady úvěrů nefinančním podnikům v ČR vyjádřené ukazatelem cost of borrowing, Míra v %, Procenta, Měsíční |
| 29.02.2024 |
Úvěry: Celkové náklady úvěrů nefinančním podnikům v EA vyjádřené ukazatelem cost of borrowing, Míra v %, Procenta, Měsíční |
| - |
Podmíněný KD odliv(-)/příliv(+) deviz.aktiv (nominál.ocenění): Měsíční, Záznam o devizových opcích, které jsou in-the-money, USD |
| - |
Podmíněný KD odliv(-)/příliv(+) deviz.aktiv (nominál.ocenění): Měsíční, Záznam o devizových opcích, které jsou in-the-money, Do 1 měsíce, USD |
| - |
Podmíněný KD odliv(-)/příliv(+) deviz.aktiv (nominál.ocenění): Měsíční, Záznam o devizových opcích, které jsou in-the-money, Nad 1 měsíc do 3 měsíců, USD |
| - |
Podmíněný KD odliv(-)/příliv(+) deviz.aktiv (nominál.ocenění): Měsíční, Záznam o devizových opcích, které jsou in-the-money, Nad 3 měsíce do 1 roku, USD |
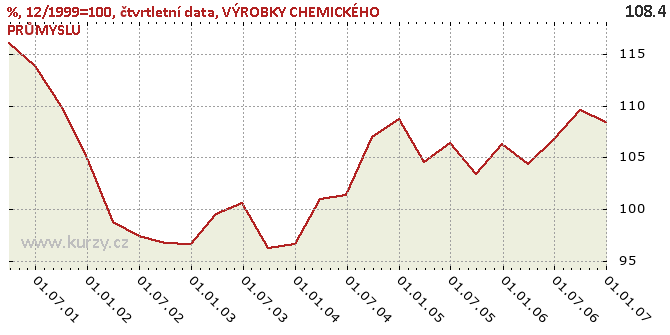
Graf hodnot, %, 12/1999=100, quarterly data
 Nahrávám interaktivní graf ...
Meziroční srovnání
Products of the chemical industry and related branches - Nahrávám graf - roční srovnání ...
Minima a maxima
Historické hodnoty
| Období |
Hodnota |
Předchozí |
Rozdíl |
Změna |
Před rokem |
Rozdíl |
Změna |
| 31.12.2006 |
108.40 |
109.60 |
-1.20 |
-1.09% |
106.30 |
2.10 |
1.98% |
| 30.09.2006 |
109.60 |
106.80 |
2.80 |
2.62% |
103.40 |
6.20 |
6.00% |
| 30.06.2006 |
106.80 |
104.40 |
2.40 |
2.30% |
106.40 |
0.40 |
0.38% |
| 31.03.2006 |
104.40 |
106.30 |
-1.90 |
-1.79% |
104.60 |
-0.20 |
-0.19% |
| 31.12.2005 |
106.30 |
103.40 |
2.90 |
2.80% |
108.70 |
-2.40 |
-2.21% |
| 30.09.2005 |
103.40 |
106.40 |
-3.00 |
-2.82% |
107.00 |
-3.60 |
-3.36% |
| 30.06.2005 |
106.40 |
104.60 |
1.80 |
1.72% |
101.40 |
5.00 |
4.93% |
| 31.03.2005 |
104.60 |
108.70 |
-4.10 |
-3.77% |
101.00 |
3.60 |
3.56% |
| 31.12.2004 |
108.70 |
107.00 |
1.70 |
1.59% |
96.60 |
12.10 |
12.53% |
| 30.09.2004 |
107.00 |
101.40 |
5.60 |
5.52% |
96.20 |
10.80 |
11.23% |
| 30.06.2004 |
101.40 |
101.00 |
0.40 |
0.40% |
100.60 |
0.80 |
0.80% |
| 31.03.2004 |
101.00 |
96.60 |
4.40 |
4.55% |
99.50 |
1.50 |
1.51% |
| 31.12.2003 |
96.60 |
96.20 |
0.40 |
0.42% |
96.60 |
0.00 |
0.00 |
| 30.09.2003 |
96.20 |
100.60 |
-4.40 |
-4.37% |
96.70 |
-0.50 |
-0.52% |
| 30.06.2003 |
100.60 |
99.50 |
1.10 |
1.11% |
97.40 |
3.20 |
3.29% |
| 31.03.2003 |
99.50 |
96.60 |
2.90 |
3.00% |
98.80 |
0.70 |
0.71% |
| 31.12.2002 |
96.60 |
96.70 |
-0.10 |
-0.10% |
104.90 |
-8.30 |
-7.91% |
| 30.09.2002 |
96.70 |
97.40 |
-0.70 |
-0.72% |
110.00 |
-13.30 |
-12.09% |
| 30.06.2002 |
97.40 |
98.80 |
-1.40 |
-1.42% |
113.80 |
-16.40 |
-14.41% |
| 31.03.2002 |
98.80 |
104.90 |
-6.10 |
-5.82% |
116.10 |
-17.30 |
-14.90% |
| 31.12.2001 |
104.90 |
110.00 |
-5.10 |
-4.64% |
- |
- |
- |
| 30.09.2001 |
110.00 |
113.80 |
-3.80 |
-3.34% |
- |
- |
- |
| 30.06.2001 |
113.80 |
116.10 |
-2.30 |
-1.98% |
- |
- |
- |
| 31.03.2001 |
116.10 |
- |
- |
- |
- |
- |
- |
Graf jako obrázek
Ekonomické ukazatele České národní banky
Podobné sestavy
| Vyberte název statistické sestavy dat, kterou chcete prohlédnout |
|---|
|
Products of the chemical industry and related branches (%, y-o-y indices, annual data)
|
|
Products of the chemical industry and related branches (%, 12/1999=100, annual data)
|
|
Products of the chemical industry and related branches (%, y-o-y indices, monthly data)
|
|
Products of the chemical industry and related branches (%, 1994=100, monthly data)
|
|
Products of the chemical industry and related branches (%, 1994=100, annual data)
|
|
Products of the chemical industry and related branches (%, 2000=100, quarterly data)
|
|
Products of the chemical industry and related branches (%, 2000=100, monthly data)
|
|
Products of the chemical industry and related branches (%, y-o-y indices, annual data)
|
|
Products of the chemical industry and related branches (%, 12/1993=100, monthly data)
|
|
Products of the chemical industry and related branches (%, 12/1999=100, monthly data)
|
|
Monetary and financial statistics (Statistical data)
|
|
Statistics of monetary developments in the CR (Monetary statistics)
|
|
Aggregated balance sheet of the Czech National Bank - assets (Balance sheet of the Czech National Bank)
|
|
Holdings of securities other than shares issued by residents - total (Aggregated balance sheet of the Czech National Bank - assets)
|
|
Holdings of securities other than shares issued by residents - MFIs (Aggregated balance sheet of the Czech National Bank - assets)
|
|
Holdings of securities other than shares issued by residents - General government (Aggregated balance sheet of the Czech National Bank - assets)
|
|
Holdings of securities other than shares issued by residents - Other residents (Aggregated balance sheet of the Czech National Bank - assets)
|
|
Holdings of shares/ other equity issued by residents - total (Aggregated balance sheet of the Czech National Bank - assets)
|
|
Holdings of shares/ other equity issued by residents - MFIs (Aggregated balance sheet of the Czech National Bank - assets)
|
|
Holdings of shares/ other equity issued by residents - Other residents (Aggregated balance sheet of the Czech National Bank - assets)
|
Aplikace Ekonomika ČNB ze sekce makroekonomika
zobrazuje časové řady hlavních makroekonomických údajů z ekonomiky ČR.
Najdete zde přes 10.000 grafů různých hodnot od úrokových sazeb, přes statistiky státního rozpočtu, statistiky ČNB a data zpracovávaná ČSÚ.
Data jsou k dispozici obvykle za posledních více než 20 let, od prosince roku 1992.
Zdroj dat: ČNB ARAD
Zobrazit sloupec


