Securities other than shares (Mixed Funds Balance Sheet) - ekonomika ČNB
Aktualizace dat Securities other than shares (Mixed Funds Balance Sheet) v této aplikaci skončila 30.6.2023. Aktualizovná data časových řad najdete na stránkách nové aplikace z dat ARAD ČNB
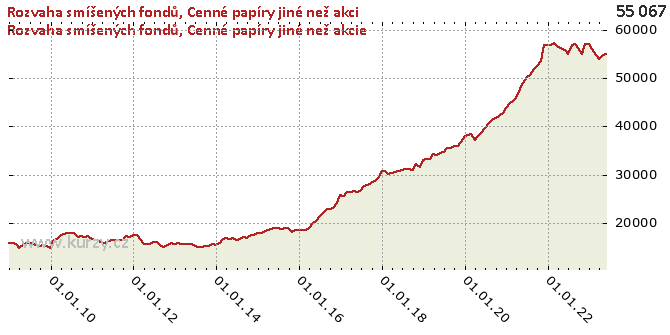
Graf hodnot, Mixed Funds Balance Sheet
Meziroční srovnání
Minima a maxima
| Typ | Období | Hodnota |
|---|---|---|
| Max | 30.06.2020 | 39 714.79 |
| Min | 31.03.2009 | 14 751.48 |
Historické hodnoty
| Období | Hodnota | Předchozí | Rozdíl | Změna | Před rokem | Rozdíl | Změna |
|---|---|---|---|---|---|---|---|
| 30.06.2020 | 39 714.79 | 38 802.53 | 912.26 | 2.35% | 34 603.30 | 5 111.48 | 14.77% |
| 31.05.2020 | 38 802.53 | 37 958.75 | 843.78 | 2.22% | 34 445.90 | 4 356.63 | 12.65% |
| 30.04.2020 | 37 958.75 | 37 251.89 | 706.86 | 1.90% | 34 071.60 | 3 887.15 | 11.41% |
| 31.03.2020 | 37 251.89 | 38 355.92 | -1 104.03 | -2.88% | 34 224.26 | 3 027.62 | 8.85% |
| 29.02.2020 | 38 355.92 | 38 159.77 | 196.14 | 0.51% | 33 229.27 | 5 126.64 | 15.43% |
| 31.01.2020 | 38 159.77 | 38 106.46 | 53.31 | 0.14% | 33 293.10 | 4 866.67 | 14.62% |
| 31.12.2019 | 38 106.46 | 36 765.37 | 1 341.10 | 3.65% | 33 081.68 | 5 024.78 | 15.19% |
| 30.11.2019 | 36 765.37 | 35 866.73 | 898.63 | 2.51% | 31 603.01 | 5 162.36 | 16.34% |
| 31.10.2019 | 35 866.73 | 35 868.99 | -2.26 | -0.01% | 32 156.28 | 3 710.45 | 11.54% |
| 30.09.2019 | 35 868.99 | 35 619.58 | 249.41 | 0.70% | 30 944.69 | 4 924.31 | 15.91% |
| 31.08.2019 | 35 619.58 | 35 467.01 | 152.57 | 0.43% | 31 210.89 | 4 408.69 | 14.13% |
| 31.07.2019 | 35 467.01 | 34 603.30 | 863.71 | 2.50% | 31 188.63 | 4 278.38 | 13.72% |
| 30.06.2019 | 34 603.30 | 34 445.90 | 157.40 | 0.46% | 31 038.83 | 3 564.47 | 11.48% |
| 31.05.2019 | 34 445.90 | 34 071.60 | 374.30 | 1.10% | 30 710.54 | 3 735.36 | 12.16% |
| 30.04.2019 | 34 071.60 | 34 224.26 | - 152.67 | -0.45% | 30 471.34 | 3 600.26 | 11.82% |
| 31.03.2019 | 34 224.26 | 33 229.27 | 994.99 | 2.99% | 30 313.15 | 3 911.11 | 12.90% |
| 28.02.2019 | 33 229.27 | 33 293.10 | -63.83 | -0.19% | 30 219.35 | 3 009.93 | 9.96% |
| 31.01.2019 | 33 293.10 | 33 081.68 | 211.42 | 0.64% | 30 704.26 | 2 588.84 | 8.43% |
| 31.12.2018 | 33 081.68 | 31 603.01 | 1 478.67 | 4.68% | 30 672.71 | 2 408.97 | 7.85% |
| 30.11.2018 | 31 603.01 | 32 156.28 | - 553.27 | -1.72% | 29 396.65 | 2 206.36 | 7.51% |
| 31.10.2018 | 32 156.28 | 30 944.69 | 1 211.59 | 3.92% | 28 731.11 | 3 425.17 | 11.92% |
| 30.09.2018 | 30 944.69 | 31 210.89 | - 266.20 | -0.85% | 28 192.65 | 2 752.03 | 9.76% |
| 31.08.2018 | 31 210.89 | 31 188.63 | 22.26 | 0.07% | 27 944.33 | 3 266.56 | 11.69% |
| 31.07.2018 | 31 188.63 | 31 038.83 | 149.81 | 0.48% | 27 641.84 | 3 546.79 | 12.83% |
| 30.06.2018 | 31 038.83 | 30 710.54 | 328.29 | 1.07% | 26 824.80 | 4 214.03 | 15.71% |
| 31.05.2018 | 30 710.54 | 30 471.34 | 239.20 | 0.78% | 26 447.29 | 4 263.24 | 16.12% |
| 30.04.2018 | 30 471.34 | 30 313.15 | 158.19 | 0.52% | 26 675.38 | 3 795.97 | 14.23% |
| 31.03.2018 | 30 313.15 | 30 219.35 | 93.81 | 0.31% | 26 423.93 | 3 889.23 | 14.72% |
| 28.02.2018 | 30 219.35 | 30 704.26 | - 484.92 | -1.58% | 26 420.80 | 3 798.55 | 14.38% |
| 31.01.2018 | 30 704.26 | 30 672.71 | 31.56 | 0.10% | 25 514.28 | 5 189.98 | 20.34% |
| 31.12.2017 | 30 672.71 | 29 396.65 | 1 276.06 | 4.34% | 25 869.26 | 4 803.44 | 18.57% |
| 30.11.2017 | 29 396.65 | 28 731.11 | 665.53 | 2.32% | 24 179.36 | 5 217.29 | 21.58% |
| 31.10.2017 | 28 731.11 | 28 192.65 | 538.46 | 1.91% | 23 092.40 | 5 638.71 | 24.42% |
| 30.09.2017 | 28 192.65 | 27 944.33 | 248.32 | 0.89% | 22 915.39 | 5 277.26 | 23.03% |
| 31.08.2017 | 27 944.33 | 27 641.84 | 302.49 | 1.09% | 22 810.32 | 5 134.01 | 22.51% |
| 31.07.2017 | 27 641.84 | 26 824.80 | 817.05 | 3.05% | 22 054.33 | 5 587.51 | 25.34% |
| 30.06.2017 | 26 824.80 | 26 447.29 | 377.50 | 1.43% | 21 383.35 | 5 441.45 | 25.45% |
| 31.05.2017 | 26 447.29 | 26 675.38 | - 228.08 | -0.85% | 20 473.27 | 5 974.03 | 29.18% |
| 30.04.2017 | 26 675.38 | 26 423.93 | 251.45 | 0.95% | 19 957.08 | 6 718.29 | 33.66% |
| 31.03.2017 | 26 423.93 | 26 420.80 | 3.13 | 0.01% | 18 872.51 | 7 551.42 | 40.01% |
| 28.02.2017 | 26 420.80 | 25 514.28 | 906.51 | 3.55% | 18 649.13 | 7 771.66 | 41.67% |
| 31.01.2017 | 25 514.28 | 25 869.26 | - 354.98 | -1.37% | 18 579.91 | 6 934.38 | 37.32% |
| 31.12.2016 | 25 869.26 | 24 179.36 | 1 689.91 | 6.99% | 18 633.12 | 7 236.14 | 38.83% |
| 30.11.2016 | 24 179.36 | 23 092.40 | 1 086.95 | 4.71% | 18 552.95 | 5 626.40 | 30.33% |
| 31.10.2016 | 23 092.40 | 22 915.39 | 177.01 | 0.77% | 18 050.70 | 5 041.70 | 27.93% |
| 30.09.2016 | 22 915.39 | 22 810.32 | 105.07 | 0.46% | 18 924.66 | 3 990.73 | 21.09% |
| 31.08.2016 | 22 810.32 | 22 054.33 | 755.99 | 3.43% | 18 889.03 | 3 921.29 | 20.76% |
| 31.07.2016 | 22 054.33 | 21 383.35 | 670.98 | 3.14% | 18 806.31 | 3 248.02 | 17.27% |
| 30.06.2016 | 21 383.35 | 20 473.27 | 910.08 | 4.45% | 18 891.63 | 2 491.72 | 13.19% |
| 31.05.2016 | 20 473.27 | 19 957.08 | 516.19 | 2.59% | 18 897.49 | 1 575.78 | 8.34% |
| 30.04.2016 | 19 957.08 | 18 872.51 | 1 084.57 | 5.75% | 18 679.15 | 1 277.93 | 6.84% |
| 31.03.2016 | 18 872.51 | 18 649.13 | 223.38 | 1.20% | 18 514.03 | 358.48 | 1.94% |
| 29.02.2016 | 18 649.13 | 18 579.91 | 69.22 | 0.37% | 18 230.53 | 418.61 | 2.30% |
| 31.01.2016 | 18 579.91 | 18 633.12 | -53.22 | -0.29% | 18 002.14 | 577.77 | 3.21% |
| 31.12.2015 | 18 633.12 | 18 552.95 | 80.17 | 0.43% | 17 864.99 | 768.13 | 4.30% |
| 30.11.2015 | 18 552.95 | 18 050.70 | 502.25 | 2.78% | 17 580.03 | 972.92 | 5.53% |
| 31.10.2015 | 18 050.70 | 18 924.66 | - 873.96 | -4.62% | 17 568.70 | 482.00 | 2.74% |
| 30.09.2015 | 18 924.66 | 18 889.03 | 35.63 | 0.19% | 16 816.01 | 2 108.65 | 12.54% |
| 31.08.2015 | 18 889.03 | 18 806.31 | 82.72 | 0.44% | 17 146.47 | 1 742.57 | 10.16% |
| 31.07.2015 | 18 806.31 | 18 891.63 | -85.32 | -0.45% | 16 757.91 | 2 048.40 | 12.22% |
| 30.06.2015 | 18 891.63 | 18 897.49 | -5.86 | -0.03% | 16 481.45 | 2 410.18 | 14.62% |
| 31.05.2015 | 18 897.49 | 18 679.15 | 218.33 | 1.17% | 16 806.14 | 2 091.34 | 12.44% |
| 30.04.2015 | 18 679.15 | 18 514.03 | 165.12 | 0.89% | 16 697.21 | 1 981.95 | 11.87% |
| 31.03.2015 | 18 514.03 | 18 230.53 | 283.51 | 1.56% | 16 818.44 | 1 695.59 | 10.08% |
| 28.02.2015 | 18 230.53 | 18 002.14 | 228.38 | 1.27% | 16 692.58 | 1 537.94 | 9.21% |
| 31.01.2015 | 18 002.14 | 17 864.99 | 137.15 | 0.77% | 15 918.84 | 2 083.30 | 13.09% |
| 31.12.2014 | 17 864.99 | 17 580.03 | 284.96 | 1.62% | 15 451.72 | 2 413.28 | 15.62% |
| 30.11.2014 | 17 580.03 | 17 568.70 | 11.33 | 0.06% | 15 715.62 | 1 864.41 | 11.86% |
| 31.10.2014 | 17 568.70 | 16 816.01 | 752.69 | 4.48% | 15 333.55 | 2 235.15 | 14.58% |
| 30.09.2014 | 16 816.01 | 17 146.47 | - 330.46 | -1.93% | 15 185.33 | 1 630.69 | 10.74% |
| 31.08.2014 | 17 146.47 | 16 757.91 | 388.56 | 2.32% | 15 060.58 | 2 085.89 | 13.85% |
| 31.07.2014 | 16 757.91 | 16 481.45 | 276.46 | 1.68% | 15 114.03 | 1 643.87 | 10.88% |
| 30.06.2014 | 16 481.45 | 16 806.14 | - 324.69 | -1.93% | 15 263.27 | 1 218.18 | 7.98% |
| 31.05.2014 | 16 806.14 | 16 697.21 | 108.94 | 0.65% | 15 613.01 | 1 193.13 | 7.64% |
| 30.04.2014 | 16 697.21 | 16 818.44 | - 121.23 | -0.72% | 15 744.10 | 953.11 | 6.05% |
| 31.03.2014 | 16 818.44 | 16 692.58 | 125.86 | 0.75% | 15 572.32 | 1 246.12 | 8.00% |
| 28.02.2014 | 16 692.58 | 15 918.84 | 773.74 | 4.86% | 15 678.88 | 1 013.70 | 6.47% |
| 31.01.2014 | 15 918.84 | 15 451.72 | 467.12 | 3.02% | 15 834.72 | 84.13 | 0.53% |
| 31.12.2013 | 15 451.72 | 15 715.62 | - 263.90 | -1.68% | 15 742.84 | - 291.13 | -1.85% |
| 30.11.2013 | 15 715.62 | 15 333.55 | 382.07 | 2.49% | 15 873.81 | - 158.19 | -1.00% |
| 31.10.2013 | 15 333.55 | 15 185.33 | 148.22 | 0.98% | 15 494.83 | - 161.28 | -1.04% |
| 30.09.2013 | 15 185.33 | 15 060.58 | 124.75 | 0.83% | 15 092.04 | 93.29 | 0.62% |
| 31.08.2013 | 15 060.58 | 15 114.03 | -53.46 | -0.35% | 15 292.96 | - 232.39 | -1.52% |
| 31.07.2013 | 15 114.03 | 15 263.27 | - 149.23 | -0.98% | 16 089.04 | - 975.00 | -6.06% |
| 30.06.2013 | 15 263.27 | 15 613.01 | - 349.74 | -2.24% | 16 059.38 | - 796.11 | -4.96% |
| 31.05.2013 | 15 613.01 | 15 744.10 | - 131.09 | -0.83% | 15 751.89 | - 138.88 | -0.88% |
| 30.04.2013 | 15 744.10 | 15 572.32 | 171.78 | 1.10% | 15 598.33 | 145.77 | 0.93% |
| 31.03.2013 | 15 572.32 | 15 678.88 | - 106.56 | -0.68% | 15 752.14 | - 179.81 | -1.14% |
| 28.02.2013 | 15 678.88 | 15 834.72 | - 155.84 | -0.98% | 16 710.94 | -1 032.06 | -6.18% |
| 31.01.2013 | 15 834.72 | 15 742.84 | 91.87 | 0.58% | 17 482.40 | -1 647.69 | -9.42% |
| 31.12.2012 | 15 742.84 | 15 873.81 | - 130.96 | -0.82% | 17 522.10 | -1 779.26 | -10.15% |
| 30.11.2012 | 15 873.81 | 15 494.83 | 378.98 | 2.45% | 17 198.62 | -1 324.81 | -7.70% |
| 31.10.2012 | 15 494.83 | 15 092.04 | 402.79 | 2.67% | 17 288.67 | -1 793.84 | -10.38% |
| 30.09.2012 | 15 092.04 | 15 292.96 | - 200.92 | -1.31% | 16 539.64 | -1 447.60 | -8.75% |
| 31.08.2012 | 15 292.96 | 16 089.04 | - 796.08 | -4.95% | 16 531.33 | -1 238.37 | -7.49% |
| 31.07.2012 | 16 089.04 | 16 059.38 | 29.66 | 0.18% | 16 481.04 | - 392.00 | -2.38% |
| 30.06.2012 | 16 059.38 | 15 751.89 | 307.49 | 1.95% | 16 570.54 | - 511.17 | -3.08% |
| 31.05.2012 | 15 751.89 | 15 598.33 | 153.56 | 0.98% | 16 334.63 | - 582.74 | -3.57% |
| 30.04.2012 | 15 598.33 | 15 752.14 | - 153.81 | -0.98% | 15 909.30 | - 310.97 | -1.95% |
| 31.03.2012 | 15 752.14 | 16 710.94 | - 958.81 | -5.74% | 15 956.33 | - 204.19 | -1.28% |
| 29.02.2012 | 16 710.94 | 17 482.40 | - 771.46 | -4.41% | 16 474.92 | 236.02 | 1.43% |
| 31.01.2012 | 17 482.40 | 17 522.10 | -39.70 | -0.23% | 16 547.58 | 934.82 | 5.65% |
| 31.12.2011 | 17 522.10 | 17 198.62 | 323.48 | 1.88% | 16 772.42 | 749.69 | 4.47% |
| 30.11.2011 | 17 198.62 | 17 288.67 | -90.05 | -0.52% | 17 255.24 | -56.62 | -0.33% |
| 31.10.2011 | 17 288.67 | 16 539.64 | 749.03 | 4.53% | 17 077.27 | 211.40 | 1.24% |
| 30.09.2011 | 16 539.64 | 16 531.33 | 8.31 | 0.05% | 17 361.06 | - 821.42 | -4.73% |
| 31.08.2011 | 16 531.33 | 16 481.04 | 50.28 | 0.30% | 17 087.79 | - 556.47 | -3.26% |
| 31.07.2011 | 16 481.04 | 16 570.54 | -89.50 | -0.54% | 17 898.55 | -1 417.51 | -7.92% |
| 30.06.2011 | 16 570.54 | 16 334.63 | 235.91 | 1.44% | 17 973.78 | -1 403.23 | -7.81% |
| 31.05.2011 | 16 334.63 | 15 909.30 | 425.33 | 2.67% | 17 900.49 | -1 565.86 | -8.75% |
| 30.04.2011 | 15 909.30 | 15 956.33 | -47.03 | -0.29% | 17 761.50 | -1 852.20 | -10.43% |
| 31.03.2011 | 15 956.33 | 16 474.92 | - 518.59 | -3.15% | 17 442.69 | -1 486.36 | -8.52% |
| 28.02.2011 | 16 474.92 | 16 547.58 | -72.66 | -0.44% | 16 711.83 | - 236.91 | -1.42% |
| 31.01.2011 | 16 547.58 | 16 772.42 | - 224.83 | -1.34% | 16 410.74 | 136.84 | 0.83% |
| 31.12.2010 | 16 772.42 | 17 255.24 | - 482.83 | -2.80% | 14 917.01 | 1 855.41 | 12.44% |
| 30.11.2010 | 17 255.24 | 17 077.27 | 177.98 | 1.04% | 15 262.27 | 1 992.97 | 13.06% |
| 31.10.2010 | 17 077.27 | 17 361.06 | - 283.79 | -1.63% | 15 372.79 | 1 704.48 | 11.09% |
| 30.09.2010 | 17 361.06 | 17 087.79 | 273.27 | 1.60% | 15 248.03 | 2 113.03 | 13.86% |
| 31.08.2010 | 17 087.79 | 17 898.55 | - 810.76 | -4.53% | 15 457.47 | 1 630.33 | 10.55% |
| 31.07.2010 | 17 898.55 | 17 973.78 | -75.22 | -0.42% | 15 676.63 | 2 221.93 | 14.17% |
| 30.06.2010 | 17 973.78 | 17 900.49 | 73.29 | 0.41% | 15 937.84 | 2 035.94 | 12.77% |
| 31.05.2010 | 17 900.49 | 17 761.50 | 138.99 | 0.78% | 15 787.67 | 2 112.81 | 13.38% |
| 30.04.2010 | 17 761.50 | 17 442.69 | 318.81 | 1.83% | 15 542.83 | 2 218.67 | 14.27% |
| 31.03.2010 | 17 442.69 | 16 711.83 | 730.85 | 4.37% | 14 751.48 | 2 691.21 | 18.24% |
| 28.02.2010 | 16 711.83 | 16 410.74 | 301.09 | 1.83% | 15 666.50 | 1 045.33 | 6.67% |
| 31.01.2010 | 16 410.74 | 14 917.01 | 1 493.73 | 10.01% | 15 843.52 | 567.22 | 3.58% |
| 31.12.2009 | 14 917.01 | 15 262.27 | - 345.26 | -2.26% | 15 846.49 | - 929.48 | -5.87% |
| 30.11.2009 | 15 262.27 | 15 372.79 | - 110.52 | -0.72% | - | - | - |
| 31.10.2009 | 15 372.79 | 15 248.03 | 124.76 | 0.82% | - | - | - |
| 30.09.2009 | 15 248.03 | 15 457.47 | - 209.43 | -1.35% | - | - | - |
| 31.08.2009 | 15 457.47 | 15 676.63 | - 219.16 | -1.40% | - | - | - |
| 31.07.2009 | 15 676.63 | 15 937.84 | - 261.21 | -1.64% | - | - | - |
| 30.06.2009 | 15 937.84 | 15 787.67 | 150.16 | 0.95% | - | - | - |
| 31.05.2009 | 15 787.67 | 15 542.83 | 244.84 | 1.58% | - | - | - |
| 30.04.2009 | 15 542.83 | 14 751.48 | 791.35 | 5.36% | - | - | - |
| 31.03.2009 | 14 751.48 | 15 666.50 | - 915.02 | -5.84% | - | - | - |
| 28.02.2009 | 15 666.50 | 15 843.52 | - 177.02 | -1.12% | - | - | - |
| 31.01.2009 | 15 843.52 | 15 846.49 | -2.97 | -0.02% | - | - | - |
| 31.12.2008 | 15 846.49 | - | - | - | - | - | - |
Graf jako obrázek

Podobné sestavy
Aplikace Ekonomika ČNB ze sekce makroekonomika zobrazuje časové řady hlavních makroekonomických údajů z ekonomiky ČR. Najdete zde přes 10.000 grafů různých hodnot od úrokových sazeb, přes statistiky státního rozpočtu, statistiky ČNB a data zpracovávaná ČSÚ. Data jsou k dispozici obvykle za posledních více než 20 let, od prosince roku 1992. Zdroj dat: ČNB ARAD

