Securities other than shares (Other Funds Balance Sheet - Flows) - ekonomika ČNB
Aktualizace dat Securities other than shares (Other Funds Balance Sheet - Flows) v této aplikaci skončila 30.6.2023. Aktualizovná data časových řad najdete na stránkách nové aplikace z dat ARAD ČNB
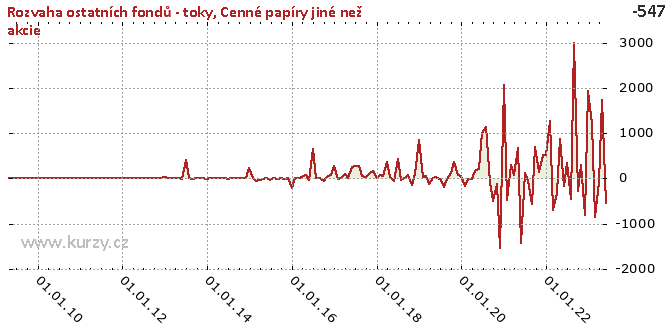
Graf hodnot, Other Funds Balance Sheet - Flows
Meziroční srovnání
Minima a maxima
| Typ | Období | Hodnota |
|---|---|---|
| Min | 31.01.2020 | - 325.27 |
| Max | 31.12.2018 | 859.76 |
Historické hodnoty
| Období | Hodnota | Předchozí | Rozdíl | Změna | Před rokem | Rozdíl | Změna |
|---|---|---|---|---|---|---|---|
| 30.06.2020 | 219.12 | 201.03 | 18.09 | 9.00% | -8.06 | 227.19 | -2 817.64% |
| 31.05.2020 | 201.03 | 163.98 | 37.06 | 22.60% | 22.14 | 178.89 | 807.81% |
| 30.04.2020 | 163.98 | -89.43 | 253.41 | - 283.35% | 20.37 | 143.60 | 704.83% |
| 31.03.2020 | -89.43 | 165.35 | - 254.78 | - 154.09% | - 118.17 | 28.74 | -24.32% |
| 29.02.2020 | 165.35 | - 325.27 | 490.62 | - 150.83% | 62.06 | 103.29 | 166.44% |
| 31.01.2020 | - 325.27 | 18.61 | - 343.88 | -1 848.11% | 24.82 | - 350.09 | -1 410.41% |
| 31.12.2019 | 18.61 | 71.59 | -52.99 | -74.01% | 859.76 | - 841.15 | -97.84% |
| 30.11.2019 | 71.59 | 374.25 | - 302.66 | -80.87% | 87.82 | -16.22 | -18.47% |
| 31.10.2019 | 374.25 | 119.61 | 254.64 | 212.89% | - 141.34 | 515.59 | - 364.79% |
| 30.09.2019 | 119.61 | -18.70 | 138.31 | - 739.64% | 73.30 | 46.31 | 63.19% |
| 31.08.2019 | -18.70 | - 189.13 | 170.43 | -90.11% | 16.45 | -35.15 | - 213.71% |
| 31.07.2019 | - 189.13 | -8.06 | - 181.07 | 2 245.64% | -33.87 | - 155.26 | 458.38% |
| 30.06.2019 | -8.06 | 22.14 | -30.21 | - 136.41% | 420.46 | - 428.52 | - 101.92% |
| 31.05.2019 | 22.14 | 20.37 | 1.77 | 8.69% | -53.30 | 75.44 | - 141.55% |
| 30.04.2019 | 20.37 | - 118.17 | 138.54 | - 117.24% | 21.88 | -1.50 | -6.88% |
| 31.03.2019 | - 118.17 | 62.06 | - 180.23 | - 290.42% | 357.00 | - 475.17 | - 133.10% |
| 28.02.2019 | 62.06 | 24.82 | 37.24 | 150.02% | 46.07 | 15.99 | 34.72% |
| 31.01.2019 | 24.82 | 859.76 | - 834.94 | -97.11% | 78.38 | -53.56 | -68.33% |
| 31.12.2018 | 859.76 | 87.82 | 771.94 | 879.04% | 13.08 | 846.68 | 6 473.58% |
| 30.11.2018 | 87.82 | - 141.34 | 229.16 | - 162.13% | 174.79 | -86.97 | -49.76% |
| 31.10.2018 | - 141.34 | 73.30 | - 214.64 | - 292.83% | 108.51 | - 249.85 | - 230.26% |
| 30.09.2018 | 73.30 | 16.45 | 56.85 | 345.69% | 42.90 | 30.40 | 70.87% |
| 31.08.2018 | 16.45 | -33.87 | 50.32 | - 148.55% | 64.66 | -48.21 | -74.56% |
| 31.07.2018 | -33.87 | 420.46 | - 454.33 | - 108.06% | 279.31 | - 313.18 | - 112.13% |
| 30.06.2018 | 420.46 | -53.30 | 473.76 | - 888.86% | 275.43 | 145.03 | 52.66% |
| 31.05.2018 | -53.30 | 21.88 | -75.18 | - 343.61% | 245.90 | - 299.20 | - 121.68% |
| 30.04.2018 | 21.88 | 357.00 | - 335.12 | -93.87% | 4.55 | 17.33 | 380.54% |
| 31.03.2018 | 357.00 | 46.07 | 310.94 | 674.98% | 103.28 | 253.72 | 245.68% |
| 28.02.2018 | 46.07 | 78.38 | -32.31 | -41.23% | 2.97 | 43.09 | 1 448.96% |
| 31.01.2018 | 78.38 | 13.08 | 65.30 | 499.28% | -4.84 | 83.22 | -1 719.09% |
| 31.12.2017 | 13.08 | 174.79 | - 161.71 | -92.52% | 271.77 | - 258.69 | -95.19% |
| 30.11.2017 | 174.79 | 108.51 | 66.28 | 61.09% | 71.24 | 103.55 | 145.35% |
| 31.10.2017 | 108.51 | 42.90 | 65.61 | 152.94% | 30.18 | 78.33 | 259.59% |
| 30.09.2017 | 42.90 | 64.66 | -21.76 | -33.65% | -64.90 | 107.80 | - 166.10% |
| 31.08.2017 | 64.66 | 279.31 | - 214.66 | -76.85% | 9.74 | 54.92 | 564.10% |
| 31.07.2017 | 279.31 | 275.43 | 3.88 | 1.41% | 5.36 | 273.96 | 5 115.93% |
| 30.06.2017 | 275.43 | 245.90 | 29.52 | 12.01% | 657.85 | - 382.42 | -58.13% |
| 31.05.2017 | 245.90 | 4.55 | 241.35 | 5 300.92% | -42.31 | 288.22 | - 681.14% |
| 30.04.2017 | 4.55 | 103.28 | -98.72 | -95.59% | 71.73 | -67.17 | -93.65% |
| 31.03.2017 | 103.28 | 2.97 | 100.30 | 3 372.63% | 42.25 | 61.03 | 144.46% |
| 28.02.2017 | 2.97 | -4.84 | 7.82 | - 161.43% | 0.00 | 2.97 | - |
| 31.01.2017 | -4.84 | 271.77 | - 276.61 | - 101.78% | 0.00 | -4.84 | - |
| 31.12.2016 | 271.77 | 71.24 | 200.53 | 281.47% | - 214.05 | 485.81 | - 226.97% |
| 30.11.2016 | 71.24 | 30.18 | 41.07 | 136.09% | 0.07 | 71.18 | 109 501.54% |
| 31.10.2016 | 30.18 | -64.90 | 95.07 | - 146.50% | -3.23 | 33.41 | -1 033.63% |
| 30.09.2016 | -64.90 | 9.74 | -74.64 | - 766.59% | 11.97 | -76.87 | - 642.00% |
| 31.08.2016 | 9.74 | 5.36 | 4.38 | 81.81% | -3.08 | 12.81 | - 416.62% |
| 31.07.2016 | 5.36 | 657.85 | - 652.50 | -99.19% | 0.00 | 5.36 | - |
| 30.06.2016 | 657.85 | -42.31 | 700.16 | -1 654.69% | -42.86 | 700.72 | -1 634.74% |
| 31.05.2016 | -42.31 | 71.73 | - 114.04 | - 158.99% | 2.77 | -45.08 | -1 629.79% |
| 30.04.2016 | 71.73 | 42.25 | 29.48 | 69.78% | -5.49 | 77.22 | -1 406.03% |
| 31.03.2016 | 42.25 | 0.00 | 42.25 | - | -39.37 | 81.62 | - 207.30% |
| 29.02.2016 | 0.00 | 0.00 | 0.00 | - | -60.99 | 60.99 | - |
| 31.01.2016 | 0.00 | - 214.05 | 214.05 | - | 16.82 | -16.82 | - |
| 31.12.2015 | - 214.05 | 0.07 | - 214.11 | - 329 401.54% | 227.34 | - 441.38 | - 194.15% |
| 30.11.2015 | 0.07 | -3.23 | 3.30 | - 102.01% | 10.88 | -10.81 | -99.40% |
| 31.10.2015 | -3.23 | 11.97 | -15.21 | - 126.99% | -0.84 | -2.40 | 286.60% |
| 30.09.2015 | 11.97 | -3.08 | 15.05 | - 489.40% | 0.00 | 11.97 | - |
| 31.08.2015 | -3.08 | 0.00 | -3.08 | - | 0.00 | -3.08 | - |
| 31.07.2015 | 0.00 | -42.86 | 42.86 | - | 2.00 | -2.00 | - |
| 30.06.2015 | -42.86 | 2.77 | -45.63 | -1 649.67% | -6.05 | -36.81 | 608.61% |
| 31.05.2015 | 2.77 | -5.49 | 8.26 | - 150.36% | 0.00 | 2.77 | - |
| 30.04.2015 | -5.49 | -39.37 | 33.88 | -86.05% | 10.45 | -15.94 | - 152.54% |
| 31.03.2015 | -39.37 | -60.99 | 21.62 | -35.45% | 0.00 | -39.37 | - |
| 28.02.2015 | -60.99 | 16.82 | -77.81 | - 462.56% | 6.67 | -67.66 | -1 014.94% |
| 31.01.2015 | 16.82 | 227.34 | - 210.52 | -92.60% | 0.00 | 16.82 | - |
| 31.12.2014 | 227.34 | 10.88 | 216.46 | 1 989.70% | -4.46 | 231.80 | -5 198.43% |
| 30.11.2014 | 10.88 | -0.84 | 11.71 | -1 401.32% | 5.62 | 5.26 | 93.54% |
| 31.10.2014 | -0.84 | 0.00 | -0.84 | - | 1.39 | -2.22 | - 160.27% |
| 30.09.2014 | 0.00 | 0.00 | 0.00 | - | 2.24 | -2.24 | - |
| 31.08.2014 | 0.00 | 2.00 | -2.00 | - | -3.28 | 3.28 | - |
| 31.07.2014 | 2.00 | -6.05 | 8.05 | - 133.13% | 0.00 | 2.00 | - |
| 30.06.2014 | -6.05 | 0.00 | -6.05 | - | 402.58 | - 408.63 | - 101.50% |
| 31.05.2014 | 0.00 | 10.45 | -10.45 | - | -1.21 | 1.21 | - |
| 30.04.2014 | 10.45 | 0.00 | 10.45 | - | 0.00 | 10.45 | - |
| 31.03.2014 | 0.00 | 6.67 | -6.67 | - | 0.00 | 0.00 | - |
| 28.02.2014 | 6.67 | 0.00 | 6.67 | - | 0.00 | 6.67 | - |
| 31.01.2014 | 0.00 | -4.46 | 4.46 | - | 0.00 | 0.00 | - |
| 31.12.2013 | -4.46 | 5.62 | -10.08 | - 179.33% | 33.07 | -37.52 | - 113.49% |
| 30.11.2013 | 5.62 | 1.39 | 4.23 | 305.26% | 0.00 | 5.62 | - |
| 31.10.2013 | 1.39 | 2.24 | -0.85 | -37.97% | 0.00 | 1.39 | - |
| 30.09.2013 | 2.24 | -3.28 | 5.52 | - 168.11% | 0.00 | 2.24 | - |
| 31.08.2013 | -3.28 | 0.00 | -3.28 | - | 0.00 | -3.28 | - |
| 31.07.2013 | 0.00 | 402.58 | - 402.58 | - | 0.00 | 0.00 | - |
| 30.06.2013 | 402.58 | -1.21 | 403.79 | -33 288.62% | 0.00 | 402.58 | - |
| 31.05.2013 | -1.21 | 0.00 | -1.21 | - | 0.00 | -1.21 | - |
| 30.04.2013 | 0.00 | 0.00 | 0.00 | - | 0.00 | 0.00 | - |
| 31.03.2013 | 0.00 | 0.00 | 0.00 | - | 0.00 | 0.00 | - |
| 28.02.2013 | 0.00 | 0.00 | 0.00 | - | 0.00 | 0.00 | - |
| 31.01.2013 | 0.00 | 33.07 | -33.07 | - | 0.00 | 0.00 | - |
| 31.12.2012 | 33.07 | 0.00 | 33.07 | - | 0.00 | 33.07 | - |
| 30.11.2012 | 0.00 | 0.00 | 0.00 | - | 0.00 | 0.00 | - |
| 31.10.2012 | 0.00 | 0.00 | 0.00 | - | 0.00 | 0.00 | - |
| 30.09.2012 | 0.00 | 0.00 | 0.00 | - | 0.00 | 0.00 | - |
| 31.08.2012 | 0.00 | 0.00 | 0.00 | - | 0.00 | 0.00 | - |
| 31.07.2012 | 0.00 | 0.00 | 0.00 | - | 0.00 | 0.00 | - |
| 30.06.2012 | 0.00 | 0.00 | 0.00 | - | 0.00 | 0.00 | - |
| 31.05.2012 | 0.00 | 0.00 | 0.00 | - | 0.00 | 0.00 | - |
| 30.04.2012 | 0.00 | 0.00 | 0.00 | - | 0.00 | 0.00 | - |
| 31.03.2012 | 0.00 | 0.00 | 0.00 | - | 0.00 | 0.00 | - |
| 29.02.2012 | 0.00 | 0.00 | 0.00 | - | 0.00 | 0.00 | - |
| 31.01.2012 | 0.00 | 0.00 | 0.00 | - | 0.00 | 0.00 | - |
| 31.12.2011 | 0.00 | 0.00 | 0.00 | - | 0.00 | 0.00 | - |
| 30.11.2011 | 0.00 | 0.00 | 0.00 | - | 0.00 | 0.00 | - |
| 31.10.2011 | 0.00 | 0.00 | 0.00 | - | 0.00 | 0.00 | - |
| 30.09.2011 | 0.00 | 0.00 | 0.00 | - | 0.00 | 0.00 | - |
| 31.08.2011 | 0.00 | 0.00 | 0.00 | - | 0.00 | 0.00 | - |
| 31.07.2011 | 0.00 | 0.00 | 0.00 | - | 0.00 | 0.00 | - |
| 30.06.2011 | 0.00 | 0.00 | 0.00 | - | 0.00 | 0.00 | - |
| 31.05.2011 | 0.00 | 0.00 | 0.00 | - | 0.00 | 0.00 | - |
| 30.04.2011 | 0.00 | 0.00 | 0.00 | - | 0.00 | 0.00 | - |
| 31.03.2011 | 0.00 | 0.00 | 0.00 | - | 0.00 | 0.00 | - |
| 28.02.2011 | 0.00 | 0.00 | 0.00 | - | 0.00 | 0.00 | - |
| 31.01.2011 | 0.00 | 0.00 | 0.00 | - | 0.00 | 0.00 | - |
| 31.12.2010 | 0.00 | 0.00 | 0.00 | - | 0.00 | 0.00 | - |
| 30.11.2010 | 0.00 | 0.00 | 0.00 | - | 0.00 | 0.00 | - |
| 31.10.2010 | 0.00 | 0.00 | 0.00 | - | 0.00 | 0.00 | - |
| 30.09.2010 | 0.00 | 0.00 | 0.00 | - | 0.00 | 0.00 | - |
| 31.08.2010 | 0.00 | 0.00 | 0.00 | - | 0.00 | 0.00 | - |
| 31.07.2010 | 0.00 | 0.00 | 0.00 | - | 0.00 | 0.00 | - |
| 30.06.2010 | 0.00 | 0.00 | 0.00 | - | 0.00 | 0.00 | - |
| 31.05.2010 | 0.00 | 0.00 | 0.00 | - | 0.00 | 0.00 | - |
| 30.04.2010 | 0.00 | 0.00 | 0.00 | - | 0.00 | 0.00 | - |
| 31.03.2010 | 0.00 | 0.00 | 0.00 | - | - | - | - |
| 28.02.2010 | 0.00 | 0.00 | 0.00 | - | - | - | - |
| 31.01.2010 | 0.00 | 0.00 | 0.00 | - | - | - | - |
| 31.12.2009 | 0.00 | 0.00 | 0.00 | - | - | - | - |
| 30.11.2009 | 0.00 | 0.00 | 0.00 | - | - | - | - |
| 31.10.2009 | 0.00 | 0.00 | 0.00 | - | - | - | - |
| 30.09.2009 | 0.00 | 0.00 | 0.00 | - | - | - | - |
| 31.08.2009 | 0.00 | 0.00 | 0.00 | - | - | - | - |
| 31.07.2009 | 0.00 | 0.00 | 0.00 | - | - | - | - |
| 30.06.2009 | 0.00 | 0.00 | 0.00 | - | - | - | - |
| 31.05.2009 | 0.00 | 0.00 | 0.00 | - | - | - | - |
| 30.04.2009 | 0.00 | - | - | - | - | - | - |
Graf jako obrázek

Podobné sestavy
Aplikace Ekonomika ČNB ze sekce makroekonomika zobrazuje časové řady hlavních makroekonomických údajů z ekonomiky ČR. Najdete zde přes 10.000 grafů různých hodnot od úrokových sazeb, přes statistiky státního rozpočtu, statistiky ČNB a data zpracovávaná ČSÚ. Data jsou k dispozici obvykle za posledních více než 20 let, od prosince roku 1992. Zdroj dat: ČNB ARAD

