Trade credits and advances (AF.81) (Liabilities, stocks, Local government) - ekonomika ČNB
Aktualizace dat Trade credits and advances (AF.81) (Liabilities, stocks, Local government) v této aplikaci skončila 30.6.2023. Aktualizovná data časových řad najdete na stránkách nové aplikace z dat ARAD ČNB
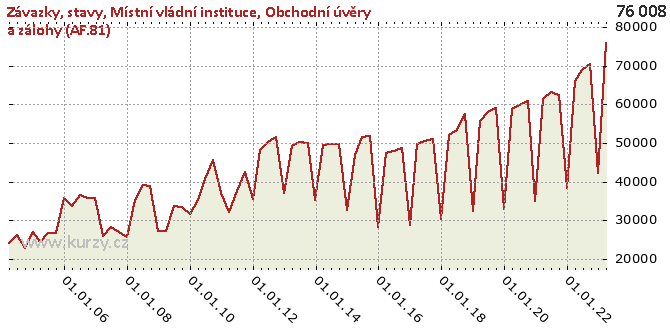
Graf hodnot, Liabilities, stocks, Local government
Meziroční srovnání
Minima a maxima
| Typ | Období | Hodnota |
|---|---|---|
| Max | 30.09.2019 | 59 029.00 |
| Min | 30.09.2004 | 22 673.00 |
Historické hodnoty
| Období | Hodnota | Předchozí | Rozdíl | Změna | Před rokem | Rozdíl | Změna |
|---|---|---|---|---|---|---|---|
| 31.03.2020 | 58 838.00 | 33 011.00 | 25 827.00 | 78.24% | 55 563.00 | 3 275.00 | 5.89% |
| 31.12.2019 | 33 011.00 | 59 029.00 | -26 018.00 | -44.08% | 32 424.00 | 587.00 | 1.81% |
| 30.09.2019 | 59 029.00 | 58 036.00 | 993.00 | 1.71% | 57 450.00 | 1 579.00 | 2.75% |
| 30.06.2019 | 58 036.00 | 55 563.00 | 2 473.00 | 4.45% | 53 361.00 | 4 675.00 | 8.76% |
| 31.03.2019 | 55 563.00 | 32 424.00 | 23 139.00 | 71.36% | 52 077.00 | 3 486.00 | 6.69% |
| 31.12.2018 | 32 424.00 | 57 450.00 | -25 026.00 | -43.56% | 30 376.00 | 2 048.00 | 6.74% |
| 30.09.2018 | 57 450.00 | 53 361.00 | 4 089.00 | 7.66% | 50 942.00 | 6 508.00 | 12.78% |
| 30.06.2018 | 53 361.00 | 52 077.00 | 1 284.00 | 2.47% | 50 582.00 | 2 779.00 | 5.49% |
| 31.03.2018 | 52 077.00 | 30 376.00 | 21 701.00 | 71.44% | 49 702.00 | 2 375.00 | 4.78% |
| 31.12.2017 | 30 376.00 | 50 942.00 | -20 566.00 | -40.37% | 28 645.00 | 1 731.00 | 6.04% |
| 30.09.2017 | 50 942.00 | 50 582.00 | 360.00 | 0.71% | 48 565.00 | 2 377.00 | 4.89% |
| 30.06.2017 | 50 582.00 | 49 702.00 | 880.00 | 1.77% | 47 966.00 | 2 616.00 | 5.45% |
| 31.03.2017 | 49 702.00 | 28 645.00 | 21 057.00 | 73.51% | 47 275.00 | 2 427.00 | 5.13% |
| 31.12.2016 | 28 645.00 | 48 565.00 | -19 920.00 | -41.02% | 28 231.00 | 414.00 | 1.47% |
| 30.09.2016 | 48 565.00 | 47 966.00 | 599.00 | 1.25% | 51 886.00 | -3 321.00 | -6.40% |
| 30.06.2016 | 47 966.00 | 47 275.00 | 691.00 | 1.46% | 51 449.00 | -3 483.00 | -6.77% |
| 31.03.2016 | 47 275.00 | 28 231.00 | 19 044.00 | 67.46% | 47 005.00 | 270.00 | 0.57% |
| 31.12.2015 | 28 231.00 | 51 886.00 | -23 655.00 | -45.59% | 32 557.00 | -4 326.00 | -13.29% |
| 30.09.2015 | 51 886.00 | 51 449.00 | 437.00 | 0.85% | 49 641.00 | 2 245.00 | 4.52% |
| 30.06.2015 | 51 449.00 | 47 005.00 | 4 444.00 | 9.45% | 49 641.00 | 1 808.00 | 3.64% |
| 31.03.2015 | 47 005.00 | 32 557.00 | 14 448.00 | 44.38% | 49 513.00 | -2 508.00 | -5.07% |
| 31.12.2014 | 32 557.00 | 49 641.00 | -17 084.00 | -34.42% | 35 097.00 | -2 540.00 | -7.24% |
| 30.09.2014 | 49 641.00 | 49 641.00 | 0.00 | 0.00 | 50 104.00 | - 463.00 | -0.92% |
| 30.06.2014 | 49 641.00 | 49 513.00 | 128.00 | 0.26% | 50 348.00 | - 707.00 | -1.40% |
| 31.03.2014 | 49 513.00 | 35 097.00 | 14 416.00 | 41.07% | 49 219.00 | 294.00 | 0.60% |
| 31.12.2013 | 35 097.00 | 50 104.00 | -15 007.00 | -29.95% | 36 904.00 | -1 807.00 | -4.90% |
| 30.09.2013 | 50 104.00 | 50 348.00 | - 244.00 | -0.48% | 51 421.00 | -1 317.00 | -2.56% |
| 30.06.2013 | 50 348.00 | 49 219.00 | 1 129.00 | 2.29% | 50 327.00 | 21.00 | 0.04% |
| 31.03.2013 | 49 219.00 | 36 904.00 | 12 315.00 | 33.37% | 48 087.00 | 1 132.00 | 2.35% |
| 31.12.2012 | 36 904.00 | 51 421.00 | -14 517.00 | -28.23% | 35 494.00 | 1 410.00 | 3.97% |
| 30.09.2012 | 51 421.00 | 50 327.00 | 1 094.00 | 2.17% | 42 592.00 | 8 829.00 | 20.73% |
| 30.06.2012 | 50 327.00 | 48 087.00 | 2 240.00 | 4.66% | 37 511.00 | 12 816.00 | 34.17% |
| 31.03.2012 | 48 087.00 | 35 494.00 | 12 593.00 | 35.48% | 32 095.00 | 15 992.00 | 49.83% |
| 31.12.2011 | 35 494.00 | 42 592.00 | -7 098.00 | -16.67% | 37 063.00 | -1 569.00 | -4.23% |
| 30.09.2011 | 42 592.00 | 37 511.00 | 5 081.00 | 13.55% | 45 533.00 | -2 941.00 | -6.46% |
| 30.06.2011 | 37 511.00 | 32 095.00 | 5 416.00 | 16.87% | 40 757.00 | -3 246.00 | -7.96% |
| 31.03.2011 | 32 095.00 | 37 063.00 | -4 968.00 | -13.40% | 35 205.00 | -3 110.00 | -8.83% |
| 31.12.2010 | 37 063.00 | 45 533.00 | -8 470.00 | -18.60% | 31 632.00 | 5 431.00 | 17.17% |
| 30.09.2010 | 45 533.00 | 40 757.00 | 4 776.00 | 11.72% | 33 338.00 | 12 195.00 | 36.58% |
| 30.06.2010 | 40 757.00 | 35 205.00 | 5 552.00 | 15.77% | 33 729.00 | 7 028.00 | 20.84% |
| 31.03.2010 | 35 205.00 | 31 632.00 | 3 573.00 | 11.30% | 27 289.00 | 7 916.00 | 29.01% |
| 31.12.2009 | 31 632.00 | 33 338.00 | -1 706.00 | -5.12% | 27 163.00 | 4 469.00 | 16.45% |
| 30.09.2009 | 33 338.00 | 33 729.00 | - 391.00 | -1.16% | 38 760.00 | -5 422.00 | -13.99% |
| 30.06.2009 | 33 729.00 | 27 289.00 | 6 440.00 | 23.60% | 39 097.00 | -5 368.00 | -13.73% |
| 31.03.2009 | 27 289.00 | 27 163.00 | 126.00 | 0.46% | 35 239.00 | -7 950.00 | -22.56% |
| 31.12.2008 | 27 163.00 | 38 760.00 | -11 597.00 | -29.92% | 25 562.00 | 1 601.00 | 6.26% |
| 30.09.2008 | 38 760.00 | 39 097.00 | - 337.00 | -0.86% | 27 054.00 | 11 706.00 | 43.27% |
| 30.06.2008 | 39 097.00 | 35 239.00 | 3 858.00 | 10.95% | 28 158.00 | 10 939.00 | 38.85% |
| 31.03.2008 | 35 239.00 | 25 562.00 | 9 677.00 | 37.86% | 25 892.00 | 9 347.00 | 36.10% |
| 31.12.2007 | 25 562.00 | 27 054.00 | -1 492.00 | -5.51% | 35 614.00 | -10 052.00 | -28.22% |
| 30.09.2007 | 27 054.00 | 28 158.00 | -1 104.00 | -3.92% | 35 755.00 | -8 701.00 | -24.34% |
| 30.06.2007 | 28 158.00 | 25 892.00 | 2 266.00 | 8.75% | 36 597.00 | -8 439.00 | -23.06% |
| 31.03.2007 | 25 892.00 | 35 614.00 | -9 722.00 | -27.30% | 33 557.00 | -7 665.00 | -22.84% |
| 31.12.2006 | 35 614.00 | 35 755.00 | - 141.00 | -0.39% | 35 809.00 | - 195.00 | -0.54% |
| 30.09.2006 | 35 755.00 | 36 597.00 | - 842.00 | -2.30% | 26 725.00 | 9 030.00 | 33.79% |
| 30.06.2006 | 36 597.00 | 33 557.00 | 3 040.00 | 9.06% | 26 793.00 | 9 804.00 | 36.59% |
| 31.03.2006 | 33 557.00 | 35 809.00 | -2 252.00 | -6.29% | 24 429.00 | 9 128.00 | 37.37% |
| 31.12.2005 | 35 809.00 | 26 725.00 | 9 084.00 | 33.99% | 27 015.00 | 8 794.00 | 32.55% |
| 30.09.2005 | 26 725.00 | 26 793.00 | -68.00 | -0.25% | 22 673.00 | 4 052.00 | 17.87% |
| 30.06.2005 | 26 793.00 | 24 429.00 | 2 364.00 | 9.68% | 26 218.00 | 575.00 | 2.19% |
| 31.03.2005 | 24 429.00 | 27 015.00 | -2 586.00 | -9.57% | 24 191.00 | 238.00 | 0.98% |
| 31.12.2004 | 27 015.00 | 22 673.00 | 4 342.00 | 19.15% | - | - | - |
| 30.09.2004 | 22 673.00 | 26 218.00 | -3 545.00 | -13.52% | - | - | - |
| 30.06.2004 | 26 218.00 | 24 191.00 | 2 027.00 | 8.38% | - | - | - |
| 31.03.2004 | 24 191.00 | - | - | - | - | - | - |
Graf jako obrázek

Podobné sestavy
Aplikace Ekonomika ČNB ze sekce makroekonomika zobrazuje časové řady hlavních makroekonomických údajů z ekonomiky ČR. Najdete zde přes 10.000 grafů různých hodnot od úrokových sazeb, přes statistiky státního rozpočtu, statistiky ČNB a data zpracovávaná ČSÚ. Data jsou k dispozici obvykle za posledních více než 20 let, od prosince roku 1992. Zdroj dat: ČNB ARAD

