Trade credits and advances (AF.81) (Liabilities, stocks, Other financial institutions) - ekonomika ČNB
Aktualizace dat Trade credits and advances (AF.81) (Liabilities, stocks, Other financial institutions) v této aplikaci skončila 30.6.2023. Aktualizovná data časových řad najdete na stránkách nové aplikace z dat ARAD ČNB
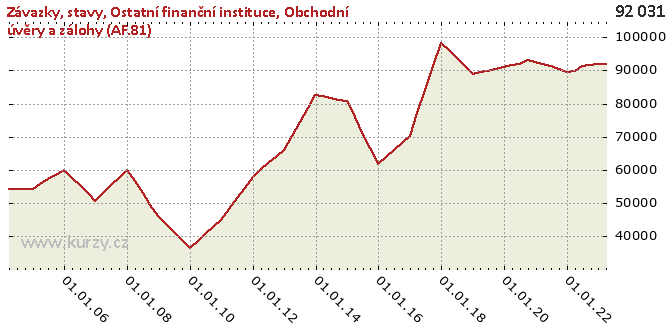
Graf hodnot, Liabilities, stocks, Other financial institutions
Meziroční srovnání
Minima a maxima
| Typ | Období | Hodnota |
|---|---|---|
| Max | 31.12.2017 | 98 349.00 |
| Min | 31.12.2009 | 36 387.00 |
Historické hodnoty
| Období | Hodnota | Předchozí | Rozdíl | Změna | Před rokem | Rozdíl | Změna |
|---|---|---|---|---|---|---|---|
| 31.03.2020 | 91 097.00 | 90 967.00 | 130.00 | 0.14% | 89 401.00 | 1 696.00 | 1.90% |
| 31.12.2019 | 90 967.00 | 90 446.00 | 521.00 | 0.58% | 88 878.00 | 2 089.00 | 2.35% |
| 30.09.2019 | 90 446.00 | 89 923.00 | 523.00 | 0.58% | 91 246.00 | - 800.00 | -0.88% |
| 30.06.2019 | 89 923.00 | 89 401.00 | 522.00 | 0.58% | 93 614.00 | -3 691.00 | -3.94% |
| 31.03.2019 | 89 401.00 | 88 878.00 | 523.00 | 0.59% | 95 982.00 | -6 581.00 | -6.86% |
| 31.12.2018 | 88 878.00 | 91 246.00 | -2 368.00 | -2.60% | 98 349.00 | -9 471.00 | -9.63% |
| 30.09.2018 | 91 246.00 | 93 614.00 | -2 368.00 | -2.53% | 91 283.00 | -37.00 | -0.04% |
| 30.06.2018 | 93 614.00 | 95 982.00 | -2 368.00 | -2.47% | 84 218.00 | 9 396.00 | 11.16% |
| 31.03.2018 | 95 982.00 | 98 349.00 | -2 367.00 | -2.41% | 77 150.00 | 18 832.00 | 24.41% |
| 31.12.2017 | 98 349.00 | 91 283.00 | 7 066.00 | 7.74% | 70 084.00 | 28 265.00 | 40.33% |
| 30.09.2017 | 91 283.00 | 84 218.00 | 7 065.00 | 8.39% | 68 037.00 | 23 246.00 | 34.17% |
| 30.06.2017 | 84 218.00 | 77 150.00 | 7 068.00 | 9.16% | 65 991.00 | 18 227.00 | 27.62% |
| 31.03.2017 | 77 150.00 | 70 084.00 | 7 066.00 | 10.08% | 63 943.00 | 13 207.00 | 20.65% |
| 31.12.2016 | 70 084.00 | 68 037.00 | 2 047.00 | 3.01% | 61 896.00 | 8 188.00 | 13.23% |
| 30.09.2016 | 68 037.00 | 65 991.00 | 2 046.00 | 3.10% | 66 580.00 | 1 457.00 | 2.19% |
| 30.06.2016 | 65 991.00 | 63 943.00 | 2 048.00 | 3.20% | 71 263.00 | -5 272.00 | -7.40% |
| 31.03.2016 | 63 943.00 | 61 896.00 | 2 047.00 | 3.31% | 75 946.00 | -12 003.00 | -15.80% |
| 31.12.2015 | 61 896.00 | 66 580.00 | -4 684.00 | -7.04% | 80 629.00 | -18 733.00 | -23.23% |
| 30.09.2015 | 66 580.00 | 71 263.00 | -4 683.00 | -6.57% | 81 142.00 | -14 562.00 | -17.95% |
| 30.06.2015 | 71 263.00 | 75 946.00 | -4 683.00 | -6.17% | 81 655.00 | -10 392.00 | -12.73% |
| 31.03.2015 | 75 946.00 | 80 629.00 | -4 683.00 | -5.81% | 82 168.00 | -6 222.00 | -7.57% |
| 31.12.2014 | 80 629.00 | 81 142.00 | - 513.00 | -0.63% | 82 680.00 | -2 051.00 | -2.48% |
| 30.09.2014 | 81 142.00 | 81 655.00 | - 513.00 | -0.63% | 78 533.00 | 2 609.00 | 3.32% |
| 30.06.2014 | 81 655.00 | 82 168.00 | - 513.00 | -0.62% | 74 386.00 | 7 269.00 | 9.77% |
| 31.03.2014 | 82 168.00 | 82 680.00 | - 512.00 | -0.62% | 70 238.00 | 11 930.00 | 16.99% |
| 31.12.2013 | 82 680.00 | 78 533.00 | 4 147.00 | 5.28% | 66 090.00 | 16 590.00 | 25.10% |
| 30.09.2013 | 78 533.00 | 74 386.00 | 4 147.00 | 5.57% | 64 038.00 | 14 495.00 | 22.63% |
| 30.06.2013 | 74 386.00 | 70 238.00 | 4 148.00 | 5.91% | 61 988.00 | 12 398.00 | 20.00% |
| 31.03.2013 | 70 238.00 | 66 090.00 | 4 148.00 | 6.28% | 59 935.00 | 10 303.00 | 17.19% |
| 31.12.2012 | 66 090.00 | 64 038.00 | 2 052.00 | 3.20% | 57 883.00 | 8 207.00 | 14.18% |
| 30.09.2012 | 64 038.00 | 61 988.00 | 2 050.00 | 3.31% | 54 667.00 | 9 371.00 | 17.14% |
| 30.06.2012 | 61 988.00 | 59 935.00 | 2 053.00 | 3.43% | 51 450.00 | 10 538.00 | 20.48% |
| 31.03.2012 | 59 935.00 | 57 883.00 | 2 052.00 | 3.54% | 48 234.00 | 11 701.00 | 24.26% |
| 31.12.2011 | 57 883.00 | 54 667.00 | 3 216.00 | 5.88% | 45 016.00 | 12 867.00 | 28.58% |
| 30.09.2011 | 54 667.00 | 51 450.00 | 3 217.00 | 6.25% | 42 859.00 | 11 808.00 | 27.55% |
| 30.06.2011 | 51 450.00 | 48 234.00 | 3 216.00 | 6.67% | 40 702.00 | 10 748.00 | 26.41% |
| 31.03.2011 | 48 234.00 | 45 016.00 | 3 218.00 | 7.15% | 38 545.00 | 9 689.00 | 25.14% |
| 31.12.2010 | 45 016.00 | 42 859.00 | 2 157.00 | 5.03% | 36 387.00 | 8 629.00 | 23.71% |
| 30.09.2010 | 42 859.00 | 40 702.00 | 2 157.00 | 5.30% | 38 790.00 | 4 069.00 | 10.49% |
| 30.06.2010 | 40 702.00 | 38 545.00 | 2 157.00 | 5.60% | 41 192.00 | - 490.00 | -1.19% |
| 31.03.2010 | 38 545.00 | 36 387.00 | 2 158.00 | 5.93% | 43 593.00 | -5 048.00 | -11.58% |
| 31.12.2009 | 36 387.00 | 38 790.00 | -2 403.00 | -6.19% | 45 995.00 | -9 608.00 | -20.89% |
| 30.09.2009 | 38 790.00 | 41 192.00 | -2 402.00 | -5.83% | 49 509.00 | -10 719.00 | -21.65% |
| 30.06.2009 | 41 192.00 | 43 593.00 | -2 401.00 | -5.51% | 53 021.00 | -11 829.00 | -22.31% |
| 31.03.2009 | 43 593.00 | 45 995.00 | -2 402.00 | -5.22% | 56 534.00 | -12 941.00 | -22.89% |
| 31.12.2008 | 45 995.00 | 49 509.00 | -3 514.00 | -7.10% | 60 046.00 | -14 051.00 | -23.40% |
| 30.09.2008 | 49 509.00 | 53 021.00 | -3 512.00 | -6.62% | 57 724.00 | -8 215.00 | -14.23% |
| 30.06.2008 | 53 021.00 | 56 534.00 | -3 513.00 | -6.21% | 55 401.00 | -2 380.00 | -4.30% |
| 31.03.2008 | 56 534.00 | 60 046.00 | -3 512.00 | -5.85% | 53 078.00 | 3 456.00 | 6.51% |
| 31.12.2007 | 60 046.00 | 57 724.00 | 2 322.00 | 4.02% | 50 755.00 | 9 291.00 | 18.31% |
| 30.09.2007 | 57 724.00 | 55 401.00 | 2 323.00 | 4.19% | 53 076.00 | 4 648.00 | 8.76% |
| 30.06.2007 | 55 401.00 | 53 078.00 | 2 323.00 | 4.38% | 55 396.00 | 5.00 | 0.01% |
| 31.03.2007 | 53 078.00 | 50 755.00 | 2 323.00 | 4.58% | 57 715.00 | -4 637.00 | -8.03% |
| 31.12.2006 | 50 755.00 | 53 076.00 | -2 321.00 | -4.37% | 60 035.00 | -9 280.00 | -15.46% |
| 30.09.2006 | 53 076.00 | 55 396.00 | -2 320.00 | -4.19% | 58 594.00 | -5 518.00 | -9.42% |
| 30.06.2006 | 55 396.00 | 57 715.00 | -2 319.00 | -4.02% | 57 154.00 | -1 758.00 | -3.08% |
| 31.03.2006 | 57 715.00 | 60 035.00 | -2 320.00 | -3.86% | 55 712.00 | 2 003.00 | 3.60% |
| 31.12.2005 | 60 035.00 | 58 594.00 | 1 441.00 | 2.46% | 54 271.00 | 5 764.00 | 10.62% |
| 30.09.2005 | 58 594.00 | 57 154.00 | 1 440.00 | 2.52% | 54 271.00 | 4 323.00 | 7.97% |
| 30.06.2005 | 57 154.00 | 55 712.00 | 1 442.00 | 2.59% | 54 271.00 | 2 883.00 | 5.31% |
| 31.03.2005 | 55 712.00 | 54 271.00 | 1 441.00 | 2.66% | 54 271.00 | 1 441.00 | 2.66% |
| 31.12.2004 | 54 271.00 | 54 271.00 | 0.00 | 0.00 | - | - | - |
| 30.09.2004 | 54 271.00 | 54 271.00 | 0.00 | 0.00 | - | - | - |
| 30.06.2004 | 54 271.00 | 54 271.00 | 0.00 | 0.00 | - | - | - |
| 31.03.2004 | 54 271.00 | - | - | - | - | - | - |
Graf jako obrázek

Podobné sestavy
Aplikace Ekonomika ČNB ze sekce makroekonomika zobrazuje časové řady hlavních makroekonomických údajů z ekonomiky ČR. Najdete zde přes 10.000 grafů různých hodnot od úrokových sazeb, přes statistiky státního rozpočtu, statistiky ČNB a data zpracovávaná ČSÚ. Data jsou k dispozici obvykle za posledních více než 20 let, od prosince roku 1992. Zdroj dat: ČNB ARAD

