Listed shares (AF.511) (Liabilities, stocks, Other financial institutions) - ekonomika ČNB
Aktualizace dat Listed shares (AF.511) (Liabilities, stocks, Other financial institutions) v této aplikaci skončila 30.6.2023. Aktualizovná data časových řad najdete na stránkách nové aplikace z dat ARAD ČNB
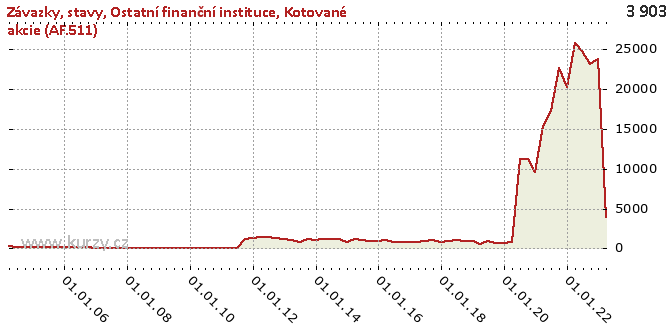
Graf hodnot, Liabilities, stocks, Other financial institutions
Meziroční srovnání
Minima a maxima
| Typ | Období | Hodnota |
|---|---|---|
| Max | 31.03.2012 | 1 426.00 |
| Min | 30.06.2006 | 126.00 |
Historické hodnoty
| Období | Hodnota | Předchozí | Rozdíl | Změna | Před rokem | Rozdíl | Změna |
|---|---|---|---|---|---|---|---|
| 31.03.2020 | 852.00 | 692.00 | 160.00 | 23.12% | 585.00 | 267.00 | 45.64% |
| 31.12.2019 | 692.00 | 735.00 | -43.00 | -5.85% | 937.00 | - 245.00 | -26.15% |
| 30.09.2019 | 735.00 | 959.00 | - 224.00 | -23.36% | 948.00 | - 213.00 | -22.47% |
| 30.06.2019 | 959.00 | 585.00 | 374.00 | 63.93% | 1 011.00 | -52.00 | -5.14% |
| 31.03.2019 | 585.00 | 937.00 | - 352.00 | -37.57% | 959.00 | - 374.00 | -39.00% |
| 31.12.2018 | 937.00 | 948.00 | -11.00 | -1.16% | 746.00 | 191.00 | 25.60% |
| 30.09.2018 | 948.00 | 1 011.00 | -63.00 | -6.23% | 1 065.00 | - 117.00 | -10.99% |
| 30.06.2018 | 1 011.00 | 959.00 | 52.00 | 5.42% | 905.00 | 106.00 | 11.71% |
| 31.03.2018 | 959.00 | 746.00 | 213.00 | 28.55% | 852.00 | 107.00 | 12.56% |
| 31.12.2017 | 746.00 | 1 065.00 | - 319.00 | -29.95% | 852.00 | - 106.00 | -12.44% |
| 30.09.2017 | 1 065.00 | 905.00 | 160.00 | 17.68% | 746.00 | 319.00 | 42.76% |
| 30.06.2017 | 905.00 | 852.00 | 53.00 | 6.22% | 746.00 | 159.00 | 21.31% |
| 31.03.2017 | 852.00 | 852.00 | 0.00 | 0.00 | 1 075.00 | - 223.00 | -20.74% |
| 31.12.2016 | 852.00 | 746.00 | 106.00 | 14.21% | 873.00 | -21.00 | -2.41% |
| 30.09.2016 | 746.00 | 746.00 | 0.00 | 0.00 | 948.00 | - 202.00 | -21.31% |
| 30.06.2016 | 746.00 | 1 075.00 | - 329.00 | -30.60% | 1 044.00 | - 298.00 | -28.54% |
| 31.03.2016 | 1 075.00 | 873.00 | 202.00 | 23.14% | 1 161.00 | -86.00 | -7.41% |
| 31.12.2015 | 873.00 | 948.00 | -75.00 | -7.91% | 831.00 | 42.00 | 5.05% |
| 30.09.2015 | 948.00 | 1 044.00 | -96.00 | -9.20% | 1 225.00 | - 277.00 | -22.61% |
| 30.06.2015 | 1 044.00 | 1 161.00 | - 117.00 | -10.08% | 1 172.00 | - 128.00 | -10.92% |
| 31.03.2015 | 1 161.00 | 831.00 | 330.00 | 39.71% | 1 172.00 | -11.00 | -0.94% |
| 31.12.2014 | 831.00 | 1 225.00 | - 394.00 | -32.16% | 1 065.00 | - 234.00 | -21.97% |
| 30.09.2014 | 1 225.00 | 1 172.00 | 53.00 | 4.52% | 1 224.00 | 1.00 | 0.08% |
| 30.06.2014 | 1 172.00 | 1 172.00 | 0.00 | 0.00 | 852.00 | 320.00 | 37.56% |
| 31.03.2014 | 1 172.00 | 1 065.00 | 107.00 | 10.05% | 1 065.00 | 107.00 | 10.05% |
| 31.12.2013 | 1 065.00 | 1 224.00 | - 159.00 | -12.99% | 1 118.00 | -53.00 | -4.74% |
| 30.09.2013 | 1 224.00 | 852.00 | 372.00 | 43.66% | 1 342.00 | - 118.00 | -8.79% |
| 30.06.2013 | 852.00 | 1 065.00 | - 213.00 | -20.00% | 1 406.00 | - 554.00 | -39.40% |
| 31.03.2013 | 1 065.00 | 1 118.00 | -53.00 | -4.74% | 1 426.00 | - 361.00 | -25.32% |
| 31.12.2012 | 1 118.00 | 1 342.00 | - 224.00 | -16.69% | 1 278.00 | - 160.00 | -12.52% |
| 30.09.2012 | 1 342.00 | 1 406.00 | -64.00 | -4.55% | 1 129.00 | 213.00 | 18.87% |
| 30.06.2012 | 1 406.00 | 1 426.00 | -20.00 | -1.40% | 0.00 | 1 406.00 | - |
| 31.03.2012 | 1 426.00 | 1 278.00 | 148.00 | 11.58% | 0.00 | 1 426.00 | - |
| 31.12.2011 | 1 278.00 | 1 129.00 | 149.00 | 13.20% | 0.00 | 1 278.00 | - |
| 30.09.2011 | 1 129.00 | 0.00 | 1 129.00 | - | 0.00 | 1 129.00 | - |
| 30.06.2011 | 0.00 | 0.00 | 0.00 | - | 0.00 | 0.00 | - |
| 31.03.2011 | 0.00 | 0.00 | 0.00 | - | 0.00 | 0.00 | - |
| 31.12.2010 | 0.00 | 0.00 | 0.00 | - | 0.00 | 0.00 | - |
| 30.09.2010 | 0.00 | 0.00 | 0.00 | - | 0.00 | 0.00 | - |
| 30.06.2010 | 0.00 | 0.00 | 0.00 | - | 0.00 | 0.00 | - |
| 31.03.2010 | 0.00 | 0.00 | 0.00 | - | 0.00 | 0.00 | - |
| 31.12.2009 | 0.00 | 0.00 | 0.00 | - | 0.00 | 0.00 | - |
| 30.09.2009 | 0.00 | 0.00 | 0.00 | - | 0.00 | 0.00 | - |
| 30.06.2009 | 0.00 | 0.00 | 0.00 | - | 0.00 | 0.00 | - |
| 31.03.2009 | 0.00 | 0.00 | 0.00 | - | 0.00 | 0.00 | - |
| 31.12.2008 | 0.00 | 0.00 | 0.00 | - | 0.00 | 0.00 | - |
| 30.09.2008 | 0.00 | 0.00 | 0.00 | - | 0.00 | 0.00 | - |
| 30.06.2008 | 0.00 | 0.00 | 0.00 | - | 0.00 | 0.00 | - |
| 31.03.2008 | 0.00 | 0.00 | 0.00 | - | 0.00 | 0.00 | - |
| 31.12.2007 | 0.00 | 0.00 | 0.00 | - | 0.00 | 0.00 | - |
| 30.09.2007 | 0.00 | 0.00 | 0.00 | - | 147.00 | - 147.00 | - |
| 30.06.2007 | 0.00 | 0.00 | 0.00 | - | 126.00 | - 126.00 | - |
| 31.03.2007 | 0.00 | 0.00 | 0.00 | - | 173.00 | - 173.00 | - |
| 31.12.2006 | 0.00 | 147.00 | - 147.00 | - | 182.00 | - 182.00 | - |
| 30.09.2006 | 147.00 | 126.00 | 21.00 | 16.67% | 182.00 | -35.00 | -19.23% |
| 30.06.2006 | 126.00 | 173.00 | -47.00 | -27.17% | 182.00 | -56.00 | -30.77% |
| 31.03.2006 | 173.00 | 182.00 | -9.00 | -4.95% | 182.00 | -9.00 | -4.95% |
| 31.12.2005 | 182.00 | 182.00 | 0.00 | 0.00 | 182.00 | 0.00 | 0.00 |
| 30.09.2005 | 182.00 | 182.00 | 0.00 | 0.00 | 204.00 | -22.00 | -10.78% |
| 30.06.2005 | 182.00 | 182.00 | 0.00 | 0.00 | 206.00 | -24.00 | -11.65% |
| 31.03.2005 | 182.00 | 182.00 | 0.00 | 0.00 | 297.00 | - 115.00 | -38.72% |
| 31.12.2004 | 182.00 | 204.00 | -22.00 | -10.78% | - | - | - |
| 30.09.2004 | 204.00 | 206.00 | -2.00 | -0.97% | - | - | - |
| 30.06.2004 | 206.00 | 297.00 | -91.00 | -30.64% | - | - | - |
| 31.03.2004 | 297.00 | - | - | - | - | - | - |
Graf jako obrázek

Podobné sestavy
Aplikace Ekonomika ČNB ze sekce makroekonomika zobrazuje časové řady hlavních makroekonomických údajů z ekonomiky ČR. Najdete zde přes 10.000 grafů různých hodnot od úrokových sazeb, přes statistiky státního rozpočtu, statistiky ČNB a data zpracovávaná ČSÚ. Data jsou k dispozici obvykle za posledních více než 20 let, od prosince roku 1992. Zdroj dat: ČNB ARAD

