Shares and other equity (AF.51) (Liabilities, transactions, Total economy) - ekonomika ČNB
Aktualizace dat Shares and other equity (AF.51) (Liabilities, transactions, Total economy) v této aplikaci skončila 30.6.2023. Aktualizovná data časových řad najdete na stránkách nové aplikace z dat ARAD ČNB
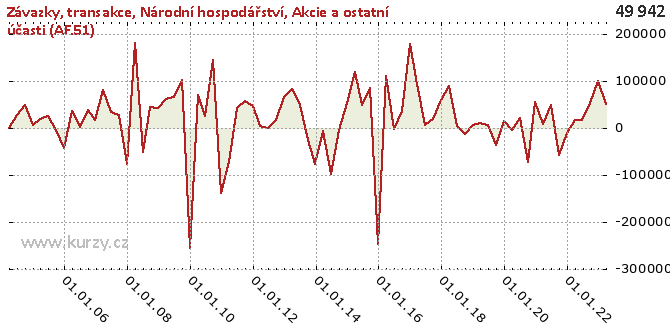
Graf hodnot, Liabilities, transactions, Total economy
Meziroční srovnání
Minima a maxima
| Typ | Období | Hodnota |
|---|---|---|
| Min | 31.12.2009 | - 256 079.00 |
| Max | 31.03.2008 | 181 101.00 |
Historické hodnoty
| Období | Hodnota | Předchozí | Rozdíl | Změna | Před rokem | Rozdíl | Změna |
|---|---|---|---|---|---|---|---|
| 31.03.2020 | -3 685.00 | 15 239.00 | -18 924.00 | - 124.18% | 11 085.00 | -14 770.00 | - 133.24% |
| 31.12.2019 | 15 239.00 | -37 244.00 | 52 483.00 | - 140.92% | 5 134.00 | 10 105.00 | 196.82% |
| 30.09.2019 | -37 244.00 | 6 667.00 | -43 911.00 | - 658.63% | -14 046.00 | -23 198.00 | 165.16% |
| 30.06.2019 | 6 667.00 | 11 085.00 | -4 418.00 | -39.86% | 3 250.00 | 3 417.00 | 105.14% |
| 31.03.2019 | 11 085.00 | 5 134.00 | 5 951.00 | 115.91% | 89 099.00 | -78 014.00 | -87.56% |
| 31.12.2018 | 5 134.00 | -14 046.00 | 19 180.00 | - 136.55% | 58 503.00 | -53 369.00 | -91.22% |
| 30.09.2018 | -14 046.00 | 3 250.00 | -17 296.00 | - 532.18% | 19 421.00 | -33 467.00 | - 172.32% |
| 30.06.2018 | 3 250.00 | 89 099.00 | -85 849.00 | -96.35% | 5 203.00 | -1 953.00 | -37.54% |
| 31.03.2018 | 89 099.00 | 58 503.00 | 30 596.00 | 52.30% | 92 747.00 | -3 648.00 | -3.93% |
| 31.12.2017 | 58 503.00 | 19 421.00 | 39 082.00 | 201.24% | 177 078.00 | - 118 575.00 | -66.96% |
| 30.09.2017 | 19 421.00 | 5 203.00 | 14 218.00 | 273.27% | 36 239.00 | -16 818.00 | -46.41% |
| 30.06.2017 | 5 203.00 | 92 747.00 | -87 544.00 | -94.39% | -1 790.00 | 6 993.00 | - 390.67% |
| 31.03.2017 | 92 747.00 | 177 078.00 | -84 331.00 | -47.62% | 109 863.00 | -17 116.00 | -15.58% |
| 31.12.2016 | 177 078.00 | 36 239.00 | 140 839.00 | 388.64% | - 246 590.00 | 423 668.00 | - 171.81% |
| 30.09.2016 | 36 239.00 | -1 790.00 | 38 029.00 | -2 124.53% | 84 511.00 | -48 272.00 | -57.12% |
| 30.06.2016 | -1 790.00 | 109 863.00 | - 111 653.00 | - 101.63% | 47 658.00 | -49 448.00 | - 103.76% |
| 31.03.2016 | 109 863.00 | - 246 590.00 | 356 453.00 | - 144.55% | 119 235.00 | -9 372.00 | -7.86% |
| 31.12.2015 | - 246 590.00 | 84 511.00 | - 331 101.00 | - 391.78% | 52 901.00 | - 299 491.00 | - 566.13% |
| 30.09.2015 | 84 511.00 | 47 658.00 | 36 853.00 | 77.33% | -4 253.00 | 88 764.00 | -2 087.09% |
| 30.06.2015 | 47 658.00 | 119 235.00 | -71 577.00 | -60.03% | -97 917.00 | 145 575.00 | - 148.67% |
| 31.03.2015 | 119 235.00 | 52 901.00 | 66 334.00 | 125.39% | -5 708.00 | 124 943.00 | -2 188.91% |
| 31.12.2014 | 52 901.00 | -4 253.00 | 57 154.00 | -1 343.85% | -77 307.00 | 130 208.00 | - 168.43% |
| 30.09.2014 | -4 253.00 | -97 917.00 | 93 664.00 | -95.66% | -25 363.00 | 21 110.00 | -83.23% |
| 30.06.2014 | -97 917.00 | -5 708.00 | -92 209.00 | 1 615.43% | 48 151.00 | - 146 068.00 | - 303.35% |
| 31.03.2014 | -5 708.00 | -77 307.00 | 71 599.00 | -92.62% | 81 494.00 | -87 202.00 | - 107.00% |
| 31.12.2013 | -77 307.00 | -25 363.00 | -51 944.00 | 204.80% | 65 384.00 | - 142 691.00 | - 218.24% |
| 30.09.2013 | -25 363.00 | 48 151.00 | -73 514.00 | - 152.67% | 17 231.00 | -42 594.00 | - 247.19% |
| 30.06.2013 | 48 151.00 | 81 494.00 | -33 343.00 | -40.91% | 513.00 | 47 638.00 | 9 286.16% |
| 31.03.2013 | 81 494.00 | 65 384.00 | 16 110.00 | 24.64% | 3 522.00 | 77 972.00 | 2 213.86% |
| 31.12.2012 | 65 384.00 | 17 231.00 | 48 153.00 | 279.46% | 46 670.00 | 18 714.00 | 40.10% |
| 30.09.2012 | 17 231.00 | 513.00 | 16 718.00 | 3 258.87% | 56 616.00 | -39 385.00 | -69.57% |
| 30.06.2012 | 513.00 | 3 522.00 | -3 009.00 | -85.43% | 41 100.00 | -40 587.00 | -98.75% |
| 31.03.2012 | 3 522.00 | 46 670.00 | -43 148.00 | -92.45% | -73 122.00 | 76 644.00 | - 104.82% |
| 31.12.2011 | 46 670.00 | 56 616.00 | -9 946.00 | -17.57% | - 138 713.00 | 185 383.00 | - 133.65% |
| 30.09.2011 | 56 616.00 | 41 100.00 | 15 516.00 | 37.75% | 144 605.00 | -87 989.00 | -60.85% |
| 30.06.2011 | 41 100.00 | -73 122.00 | 114 222.00 | - 156.21% | 25 850.00 | 15 250.00 | 58.99% |
| 31.03.2011 | -73 122.00 | - 138 713.00 | 65 591.00 | -47.29% | 70 825.00 | - 143 947.00 | - 203.24% |
| 31.12.2010 | - 138 713.00 | 144 605.00 | - 283 318.00 | - 195.93% | - 256 079.00 | 117 366.00 | -45.83% |
| 30.09.2010 | 144 605.00 | 25 850.00 | 118 755.00 | 459.40% | 101 776.00 | 42 829.00 | 42.08% |
| 30.06.2010 | 25 850.00 | 70 825.00 | -44 975.00 | -63.50% | 66 522.00 | -40 672.00 | -61.14% |
| 31.03.2010 | 70 825.00 | - 256 079.00 | 326 904.00 | - 127.66% | 61 303.00 | 9 522.00 | 15.53% |
| 31.12.2009 | - 256 079.00 | 101 776.00 | - 357 855.00 | - 351.61% | 42 075.00 | - 298 154.00 | - 708.62% |
| 30.09.2009 | 101 776.00 | 66 522.00 | 35 254.00 | 53.00% | 45 298.00 | 56 478.00 | 124.68% |
| 30.06.2009 | 66 522.00 | 61 303.00 | 5 219.00 | 8.51% | -50 923.00 | 117 445.00 | - 230.63% |
| 31.03.2009 | 61 303.00 | 42 075.00 | 19 228.00 | 45.70% | 181 101.00 | - 119 798.00 | -66.15% |
| 31.12.2008 | 42 075.00 | 45 298.00 | -3 223.00 | -7.12% | -76 359.00 | 118 434.00 | - 155.10% |
| 30.09.2008 | 45 298.00 | -50 923.00 | 96 221.00 | - 188.95% | 27 602.00 | 17 696.00 | 64.11% |
| 30.06.2008 | -50 923.00 | 181 101.00 | - 232 024.00 | - 128.12% | 33 376.00 | -84 299.00 | - 252.57% |
| 31.03.2008 | 181 101.00 | -76 359.00 | 257 460.00 | - 337.17% | 80 822.00 | 100 279.00 | 124.07% |
| 31.12.2007 | -76 359.00 | 27 602.00 | - 103 961.00 | - 376.64% | 16 383.00 | -92 742.00 | - 566.09% |
| 30.09.2007 | 27 602.00 | 33 376.00 | -5 774.00 | -17.30% | 38 379.00 | -10 777.00 | -28.08% |
| 30.06.2007 | 33 376.00 | 80 822.00 | -47 446.00 | -58.70% | 2 296.00 | 31 080.00 | 1 353.66% |
| 31.03.2007 | 80 822.00 | 16 383.00 | 64 439.00 | 393.33% | 36 677.00 | 44 145.00 | 120.36% |
| 31.12.2006 | 16 383.00 | 38 379.00 | -21 996.00 | -57.31% | -43 009.00 | 59 392.00 | - 138.09% |
| 30.09.2006 | 38 379.00 | 2 296.00 | 36 083.00 | 1 571.56% | -3 829.00 | 42 208.00 | -1 102.32% |
| 30.06.2006 | 2 296.00 | 36 677.00 | -34 381.00 | -93.74% | 26 163.00 | -23 867.00 | -91.22% |
| 31.03.2006 | 36 677.00 | -43 009.00 | 79 686.00 | - 185.28% | 19 204.00 | 17 473.00 | 90.99% |
| 31.12.2005 | -43 009.00 | -3 829.00 | -39 180.00 | 1 023.24% | 5 184.00 | -48 193.00 | - 929.65% |
| 30.09.2005 | -3 829.00 | 26 163.00 | -29 992.00 | - 114.64% | 48 284.00 | -52 113.00 | - 107.93% |
| 30.06.2005 | 26 163.00 | 19 204.00 | 6 959.00 | 36.24% | 27 399.00 | -1 236.00 | -4.51% |
| 31.03.2005 | 19 204.00 | 5 184.00 | 14 020.00 | 270.45% | 0.00 | 19 204.00 | - |
| 31.12.2004 | 5 184.00 | 48 284.00 | -43 100.00 | -89.26% | - | - | - |
| 30.09.2004 | 48 284.00 | 27 399.00 | 20 885.00 | 76.23% | - | - | - |
| 30.06.2004 | 27 399.00 | 0.00 | 27 399.00 | - | - | - | - |
| 31.03.2004 | 0.00 | - | - | - | - | - | - |
Graf jako obrázek

Podobné sestavy
Aplikace Ekonomika ČNB ze sekce makroekonomika zobrazuje časové řady hlavních makroekonomických údajů z ekonomiky ČR. Najdete zde přes 10.000 grafů různých hodnot od úrokových sazeb, přes statistiky státního rozpočtu, statistiky ČNB a data zpracovávaná ČSÚ. Data jsou k dispozici obvykle za posledních více než 20 let, od prosince roku 1992. Zdroj dat: ČNB ARAD

