Other liabilities (Real Estate Funds Balance Sheet - Flows) - ekonomika ČNB
Aktualizace dat Other liabilities (Real Estate Funds Balance Sheet - Flows) v této aplikaci skončila 30.6.2023. Aktualizovná data časových řad najdete na stránkách nové aplikace z dat ARAD ČNB
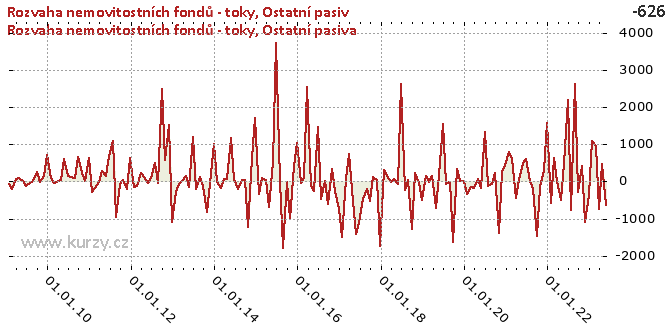
Graf hodnot, Real Estate Funds Balance Sheet - Flows
Meziroční srovnání
Minima a maxima
| Typ | Období | Hodnota |
|---|---|---|
| Min | 31.08.2015 | -1 802.40 |
| Max | 30.06.2015 | 3 730.14 |
Historické hodnoty
| Období | Hodnota | Předchozí | Rozdíl | Změna | Před rokem | Rozdíl | Změna |
|---|---|---|---|---|---|---|---|
| 30.06.2020 | 718.10 | - 369.09 | 1 087.19 | - 294.56% | 1 535.96 | - 817.86 | -53.25% |
| 31.05.2020 | - 369.09 | 191.94 | - 561.03 | - 292.30% | 160.62 | - 529.71 | - 329.80% |
| 30.04.2020 | 191.94 | - 941.43 | 1 133.37 | - 120.39% | - 702.98 | 894.92 | - 127.30% |
| 31.03.2020 | - 941.43 | -74.36 | - 867.07 | 1 166.03% | 148.88 | -1 090.32 | - 732.34% |
| 29.02.2020 | -74.36 | - 411.14 | 336.78 | -81.91% | -12.64 | -61.72 | 488.11% |
| 31.01.2020 | - 411.14 | 821.36 | -1 232.50 | - 150.06% | 142.21 | - 553.36 | - 389.10% |
| 31.12.2019 | 821.36 | 4.14 | 817.22 | 19 739.54% | - 501.76 | 1 323.11 | - 263.70% |
| 30.11.2019 | 4.14 | 339.02 | - 334.88 | -98.78% | -33.65 | 37.79 | - 112.30% |
| 31.10.2019 | 339.02 | -1 641.24 | 1 980.26 | - 120.66% | 214.47 | 124.54 | 58.07% |
| 30.09.2019 | -1 641.24 | -9.62 | -1 631.63 | 16 969.60% | -1 271.50 | - 369.75 | 29.08% |
| 31.08.2019 | -9.62 | -77.91 | 68.29 | -87.66% | 27.58 | -37.20 | - 134.86% |
| 31.07.2019 | -77.91 | 1 535.96 | -1 613.87 | - 105.07% | - 240.84 | 162.93 | -67.65% |
| 30.06.2019 | 1 535.96 | 160.62 | 1 375.34 | 856.29% | 2 612.07 | -1 076.11 | -41.20% |
| 31.05.2019 | 160.62 | - 702.98 | 863.60 | - 122.85% | -79.79 | 240.41 | - 301.30% |
| 30.04.2019 | - 702.98 | 148.88 | - 851.86 | - 572.18% | 60.76 | - 763.74 | -1 257.00% |
| 31.03.2019 | 148.88 | -12.64 | 161.53 | -1 277.48% | -24.76 | 173.64 | - 701.37% |
| 28.02.2019 | -12.64 | 142.21 | - 154.86 | - 108.89% | 137.46 | - 150.11 | - 109.20% |
| 31.01.2019 | 142.21 | - 501.76 | 643.97 | - 128.34% | 301.33 | - 159.12 | -52.80% |
| 31.12.2018 | - 501.76 | -33.65 | - 468.11 | 1 391.19% | -1 748.12 | 1 246.36 | -71.30% |
| 30.11.2018 | -33.65 | 214.47 | - 248.12 | - 115.69% | 38.30 | -71.95 | - 187.85% |
| 31.10.2018 | 214.47 | -1 271.50 | 1 485.97 | - 116.87% | 121.70 | 92.78 | 76.24% |
| 30.09.2018 | -1 271.50 | 27.58 | -1 299.08 | -4 709.71% | - 524.25 | - 747.25 | 142.54% |
| 31.08.2018 | 27.58 | - 240.84 | 268.42 | - 111.45% | - 198.47 | 226.05 | - 113.90% |
| 31.07.2018 | - 240.84 | 2 612.07 | -2 852.91 | - 109.22% | - 465.68 | 224.84 | -48.28% |
| 30.06.2018 | 2 612.07 | -79.79 | 2 691.86 | -3 373.77% | -1 131.65 | 3 743.72 | - 330.82% |
| 31.05.2018 | -79.79 | 60.76 | - 140.55 | - 231.32% | -1 425.49 | 1 345.70 | -94.40% |
| 30.04.2018 | 60.76 | -24.76 | 85.52 | - 345.42% | - 530.49 | 591.25 | - 111.45% |
| 31.03.2018 | -24.76 | 137.46 | - 162.22 | - 118.01% | 746.98 | - 771.74 | - 103.31% |
| 28.02.2018 | 137.46 | 301.33 | - 163.87 | -54.38% | 55.45 | 82.01 | 147.90% |
| 31.01.2018 | 301.33 | -1 748.12 | 2 049.45 | - 117.24% | -1 487.12 | 1 788.45 | - 120.26% |
| 31.12.2017 | -1 748.12 | 38.30 | -1 786.42 | -4 664.28% | - 746.53 | -1 001.59 | 134.17% |
| 30.11.2017 | 38.30 | 121.70 | -83.40 | -68.53% | - 256.76 | 295.06 | - 114.92% |
| 31.10.2017 | 121.70 | - 524.25 | 645.94 | - 123.21% | 327.34 | - 205.64 | -62.82% |
| 30.09.2017 | - 524.25 | - 198.47 | - 325.78 | 164.15% | - 615.88 | 91.64 | -14.88% |
| 31.08.2017 | - 198.47 | - 465.68 | 267.21 | -57.38% | 10.63 | - 209.09 | -1 967.76% |
| 31.07.2017 | - 465.68 | -1 131.65 | 665.97 | -58.85% | - 476.42 | 10.73 | -2.25% |
| 30.06.2017 | -1 131.65 | -1 425.49 | 293.84 | -20.61% | 1 449.15 | -2 580.80 | - 178.09% |
| 31.05.2017 | -1 425.49 | - 530.49 | - 895.00 | 168.71% | - 264.31 | -1 161.18 | 439.32% |
| 30.04.2017 | - 530.49 | 746.98 | -1 277.48 | - 171.02% | - 122.94 | - 407.55 | 331.49% |
| 31.03.2017 | 746.98 | 55.45 | 691.53 | 1 247.13% | 2 548.92 | -1 801.94 | -70.69% |
| 28.02.2017 | 55.45 | -1 487.12 | 1 542.57 | - 103.73% | 93.09 | -37.64 | -40.43% |
| 31.01.2017 | -1 487.12 | - 746.53 | - 740.59 | 99.20% | -52.06 | -1 435.06 | 2 756.55% |
| 31.12.2016 | - 746.53 | - 256.76 | - 489.77 | 190.75% | 1 029.63 | -1 776.16 | - 172.50% |
| 30.11.2016 | - 256.76 | 327.34 | - 584.10 | - 178.44% | 400.60 | - 657.36 | - 164.09% |
| 31.10.2016 | 327.34 | - 615.88 | 943.22 | - 153.15% | -1 001.33 | 1 328.67 | - 132.69% |
| 30.09.2016 | - 615.88 | 10.63 | - 626.51 | -5 895.99% | -13.50 | - 602.38 | 4 461.08% |
| 31.08.2016 | 10.63 | - 476.42 | 487.04 | - 102.23% | -1 802.40 | 1 813.03 | - 100.59% |
| 31.07.2016 | - 476.42 | 1 449.15 | -1 925.56 | - 132.88% | 10.11 | - 486.52 | -4 814.66% |
| 30.06.2016 | 1 449.15 | - 264.31 | 1 713.46 | - 648.27% | 3 730.14 | -2 280.99 | -61.15% |
| 31.05.2016 | - 264.31 | - 122.94 | - 141.37 | 114.98% | 510.01 | - 774.32 | - 151.82% |
| 30.04.2016 | - 122.94 | 2 548.92 | -2 671.86 | - 104.82% | - 696.30 | 573.36 | -82.34% |
| 31.03.2016 | 2 548.92 | 93.09 | 2 455.83 | 2 638.12% | 45.16 | 2 503.76 | 5 543.82% |
| 29.02.2016 | 93.09 | -52.06 | 145.15 | - 278.81% | 87.19 | 5.90 | 6.76% |
| 31.01.2016 | -52.06 | 1 029.63 | -1 081.69 | - 105.06% | - 343.72 | 291.66 | -84.85% |
| 31.12.2015 | 1 029.63 | 400.60 | 629.03 | 157.02% | 1 696.71 | - 667.08 | -39.32% |
| 30.11.2015 | 400.60 | -1 001.33 | 1 401.93 | - 140.01% | 639.35 | - 238.75 | -37.34% |
| 31.10.2015 | -1 001.33 | -13.50 | - 987.83 | 7 315.62% | -1 218.76 | 217.43 | -17.84% |
| 30.09.2015 | -13.50 | -1 802.40 | 1 788.90 | -99.25% | 25.71 | -39.21 | - 152.53% |
| 31.08.2015 | -1 802.40 | 10.11 | -1 812.51 | -17 936.72% | 39.57 | -1 841.97 | -4 654.62% |
| 31.07.2015 | 10.11 | 3 730.14 | -3 720.03 | -99.73% | - 208.36 | 218.47 | - 104.85% |
| 30.06.2015 | 3 730.14 | 510.01 | 3 220.12 | 631.38% | 57.87 | 3 672.27 | 6 345.83% |
| 31.05.2015 | 510.01 | - 696.30 | 1 206.32 | - 173.25% | 1 157.50 | - 647.49 | -55.94% |
| 30.04.2015 | - 696.30 | 45.16 | - 741.47 | -1 641.76% | 55.79 | - 752.10 | -1 348.01% |
| 31.03.2015 | 45.16 | 87.19 | -42.03 | -48.20% | 62.33 | -17.17 | -27.55% |
| 28.02.2015 | 87.19 | - 343.72 | 430.91 | - 125.37% | - 166.42 | 253.61 | - 152.39% |
| 31.01.2015 | - 343.72 | 1 696.71 | -2 040.43 | - 120.26% | -8.65 | - 335.07 | 3 874.56% |
| 31.12.2014 | 1 696.71 | 639.35 | 1 057.37 | 165.38% | 1 010.87 | 685.84 | 67.85% |
| 30.11.2014 | 639.35 | -1 218.76 | 1 858.11 | - 152.46% | -65.66 | 705.01 | -1 073.67% |
| 31.10.2014 | -1 218.76 | 25.71 | -1 244.46 | -4 841.15% | - 835.14 | - 383.61 | 45.93% |
| 30.09.2014 | 25.71 | 39.57 | -13.87 | -35.04% | - 130.73 | 156.44 | - 119.66% |
| 31.08.2014 | 39.57 | - 208.36 | 247.93 | - 118.99% | 123.92 | -84.34 | -68.06% |
| 31.07.2014 | - 208.36 | 57.87 | - 266.23 | - 460.06% | - 209.28 | 0.92 | -0.44% |
| 30.06.2014 | 57.87 | 1 157.50 | -1 099.63 | -95.00% | 1 204.87 | -1 147.00 | -95.20% |
| 31.05.2014 | 1 157.50 | 55.79 | 1 101.71 | 1 974.64% | - 151.49 | 1 308.99 | - 864.09% |
| 30.04.2014 | 55.79 | 62.33 | -6.54 | -10.49% | 153.60 | -97.81 | -63.68% |
| 31.03.2014 | 62.33 | - 166.42 | 228.75 | - 137.46% | 12.14 | 50.20 | 413.62% |
| 28.02.2014 | - 166.42 | -8.65 | - 157.77 | 1 824.35% | -66.54 | -99.88 | 150.09% |
| 31.01.2014 | -8.65 | 1 010.87 | -1 019.52 | - 100.86% | - 292.65 | 284.00 | -97.04% |
| 31.12.2013 | 1 010.87 | -65.66 | 1 076.54 | -1 639.46% | -1 081.40 | 2 092.27 | - 193.48% |
| 30.11.2013 | -65.66 | - 835.14 | 769.48 | -92.14% | 1 520.41 | -1 586.08 | - 104.32% |
| 31.10.2013 | - 835.14 | - 130.73 | - 704.42 | 538.84% | 572.92 | -1 408.06 | - 245.77% |
| 30.09.2013 | - 130.73 | 123.92 | - 254.65 | - 205.50% | 2 476.25 | -2 606.98 | - 105.28% |
| 31.08.2013 | 123.92 | - 209.28 | 333.20 | - 159.21% | -50.69 | 174.61 | - 344.46% |
| 31.07.2013 | - 209.28 | 1 204.87 | -1 414.15 | - 117.37% | 504.89 | - 714.17 | - 141.45% |
| 30.06.2013 | 1 204.87 | - 151.49 | 1 356.36 | - 895.36% | 91.60 | 1 113.27 | 1 215.40% |
| 31.05.2013 | - 151.49 | 153.60 | - 305.09 | - 198.62% | -38.86 | - 112.63 | 289.85% |
| 30.04.2013 | 153.60 | 12.14 | 141.47 | 1 165.66% | 113.92 | 39.68 | 34.83% |
| 31.03.2013 | 12.14 | -66.54 | 78.68 | - 118.24% | 229.48 | - 217.35 | -94.71% |
| 28.02.2013 | -66.54 | - 292.65 | 226.11 | -77.26% | - 129.72 | 63.18 | -48.70% |
| 31.01.2013 | - 292.65 | -1 081.40 | 788.75 | -72.94% | - 155.35 | - 137.30 | 88.38% |
| 31.12.2012 | -1 081.40 | 1 520.41 | -2 601.81 | - 171.13% | 622.89 | -1 704.29 | - 273.61% |
| 30.11.2012 | 1 520.41 | 572.92 | 947.49 | 165.38% | - 203.31 | 1 723.72 | - 847.84% |
| 31.10.2012 | 572.92 | 2 476.25 | -1 903.33 | -76.86% | 44.61 | 528.31 | 1 184.22% |
| 30.09.2012 | 2 476.25 | -50.69 | 2 526.94 | -4 985.08% | -82.74 | 2 558.99 | -3 092.88% |
| 31.08.2012 | -50.69 | 504.89 | - 555.58 | - 110.04% | - 965.84 | 915.15 | -94.75% |
| 31.07.2012 | 504.89 | 91.60 | 413.30 | 451.21% | 1 094.71 | - 589.82 | -53.88% |
| 30.06.2012 | 91.60 | -38.86 | 130.46 | - 335.72% | 687.23 | - 595.63 | -86.67% |
| 31.05.2012 | -38.86 | 113.92 | - 152.78 | - 134.11% | 141.70 | - 180.56 | - 127.42% |
| 30.04.2012 | 113.92 | 229.48 | - 115.56 | -50.36% | 272.70 | - 158.78 | -58.23% |
| 31.03.2012 | 229.48 | - 129.72 | 359.20 | - 276.90% | -13.51 | 242.99 | -1 799.24% |
| 29.02.2012 | - 129.72 | - 155.35 | 25.63 | -16.50% | - 191.13 | 61.40 | -32.13% |
| 31.01.2012 | - 155.35 | 622.89 | - 778.24 | - 124.94% | - 297.65 | 142.30 | -47.81% |
| 31.12.2011 | 622.89 | - 203.31 | 826.20 | - 406.38% | 641.19 | -18.30 | -2.85% |
| 30.11.2011 | - 203.31 | 44.61 | - 247.92 | - 555.72% | 13.85 | - 217.16 | -1 567.82% |
| 31.10.2011 | 44.61 | -82.74 | 127.35 | - 153.92% | 225.03 | - 180.42 | -80.18% |
| 30.09.2011 | -82.74 | - 965.84 | 883.10 | -91.43% | 651.37 | - 734.11 | - 112.70% |
| 31.08.2011 | - 965.84 | 1 094.71 | -2 060.55 | - 188.23% | 80.88 | -1 046.72 | -1 294.10% |
| 31.07.2011 | 1 094.71 | 687.23 | 407.48 | 59.29% | 108.01 | 986.70 | 913.56% |
| 30.06.2011 | 687.23 | 141.70 | 545.53 | 385.00% | 145.99 | 541.24 | 370.74% |
| 31.05.2011 | 141.70 | 272.70 | - 131.01 | -48.04% | 591.48 | - 449.79 | -76.04% |
| 30.04.2011 | 272.70 | -13.51 | 286.21 | -2 119.28% | 25.06 | 247.64 | 988.16% |
| 31.03.2011 | -13.51 | - 191.13 | 177.62 | -92.93% | -21.55 | 8.04 | -37.32% |
| 28.02.2011 | - 191.13 | - 297.65 | 106.52 | -35.79% | -48.41 | - 142.72 | 294.85% |
| 31.01.2011 | - 297.65 | 641.19 | - 938.84 | - 146.42% | 102.61 | - 400.25 | - 390.09% |
| 31.12.2010 | 641.19 | 13.85 | 627.34 | 4 529.21% | 706.34 | -65.15 | -9.22% |
| 30.11.2010 | 13.85 | 225.03 | - 211.18 | -93.84% | 153.72 | - 139.87 | -90.99% |
| 31.10.2010 | 225.03 | 651.37 | - 426.33 | -65.45% | -24.95 | 249.99 | -1 001.84% |
| 30.09.2010 | 651.37 | 80.88 | 570.49 | 705.31% | 239.54 | 411.83 | 171.93% |
| 31.08.2010 | 80.88 | 108.01 | -27.12 | -25.11% | 6.82 | 74.06 | 1 086.16% |
| 31.07.2010 | 108.01 | 145.99 | -37.98 | -26.02% | -54.90 | 162.90 | - 296.75% |
| 30.06.2010 | 145.99 | 591.48 | - 445.49 | -75.32% | - 112.34 | 258.33 | - 229.95% |
| 31.05.2010 | 591.48 | 25.06 | 566.42 | 2 260.17% | 12.10 | 579.38 | 4 787.08% |
| 30.04.2010 | 25.06 | -21.55 | 46.61 | - 216.32% | 88.52 | -63.46 | -71.69% |
| 31.03.2010 | -21.55 | -48.41 | 26.86 | -55.49% | 62.58 | -84.13 | - 134.43% |
| 28.02.2010 | -48.41 | 102.61 | - 151.01 | - 147.18% | - 206.16 | 157.76 | -76.52% |
| 31.01.2010 | 102.61 | 706.34 | - 603.74 | -85.47% | -62.48 | 165.08 | - 264.23% |
| 31.12.2009 | 706.34 | 153.72 | 552.62 | 359.48% | - | - | - |
| 30.11.2009 | 153.72 | -24.95 | 178.68 | - 716.06% | - | - | - |
| 31.10.2009 | -24.95 | 239.54 | - 264.49 | - 110.42% | - | - | - |
| 30.09.2009 | 239.54 | 6.82 | 232.72 | 3 412.82% | - | - | - |
| 31.08.2009 | 6.82 | -54.90 | 61.72 | - 112.42% | - | - | - |
| 31.07.2009 | -54.90 | - 112.34 | 57.45 | -51.14% | - | - | - |
| 30.06.2009 | - 112.34 | 12.10 | - 124.45 | -1 028.22% | - | - | - |
| 31.05.2009 | 12.10 | 88.52 | -76.42 | -86.33% | - | - | - |
| 30.04.2009 | 88.52 | 62.58 | 25.94 | 41.45% | - | - | - |
| 31.03.2009 | 62.58 | - 206.16 | 268.74 | - 130.36% | - | - | - |
| 28.02.2009 | - 206.16 | -62.48 | - 143.69 | 229.98% | - | - | - |
| 31.01.2009 | -62.48 | - | - | - | - | - | - |
Graf jako obrázek

Podobné sestavy
Aplikace Ekonomika ČNB ze sekce makroekonomika zobrazuje časové řady hlavních makroekonomických údajů z ekonomiky ČR. Najdete zde přes 10.000 grafů různých hodnot od úrokových sazeb, přes statistiky státního rozpočtu, statistiky ČNB a data zpracovávaná ČSÚ. Data jsou k dispozici obvykle za posledních více než 20 let, od prosince roku 1992. Zdroj dat: ČNB ARAD

