Holdings of securities other than shares issued by residents - ekonomika ČNB
Aktualizace dat Holdings of securities other than shares issued by residents v této aplikaci skončila 30.6.2023. Aktualizovná data časových řad najdete na stránkách nové aplikace z dat ARAD ČNB
Nové časové řady makroekonomiky a jejich data
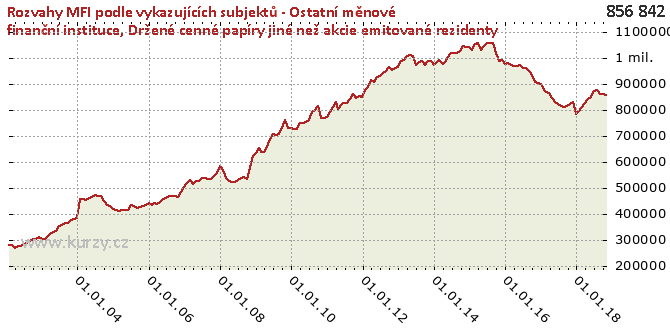
Graf hodnot, Balance sheets of MFIs by reporting institutions - Other Monetary Financial Institutions
Meziroční srovnání
Minima a maxima
| Typ | Období | Hodnota |
|---|---|---|
| Max | 31.08.2015 | 1 059 091.30 |
| Min | 31.03.2002 | 268 743.75 |
Historické hodnoty
| Období | Hodnota | Předchozí | Rozdíl | Změna | Před rokem | Rozdíl | Změna |
|---|---|---|---|---|---|---|---|
| 31.10.2018 | 856 842.26 | 860 830.83 | -3 988.56 | -0.46% | 823 391.87 | 33 450.39 | 4.06% |
| 30.09.2018 | 860 830.83 | 862 480.40 | -1 649.57 | -0.19% | 813 890.11 | 46 940.72 | 5.77% |
| 31.08.2018 | 862 480.40 | 876 240.14 | -13 759.74 | -1.57% | 812 745.81 | 49 734.59 | 6.12% |
| 31.07.2018 | 876 240.14 | 871 455.50 | 4 784.64 | 0.55% | 814 640.19 | 61 599.94 | 7.56% |
| 30.06.2018 | 871 455.50 | 849 965.50 | 21 489.99 | 2.53% | 824 506.87 | 46 948.63 | 5.69% |
| 31.05.2018 | 849 965.50 | 840 560.40 | 9 405.10 | 1.12% | 831 957.07 | 18 008.43 | 2.16% |
| 30.04.2018 | 840 560.40 | 826 936.64 | 13 623.76 | 1.65% | 845 649.88 | -5 089.49 | -0.60% |
| 31.03.2018 | 826 936.64 | 812 561.09 | 14 375.55 | 1.77% | 864 654.31 | -37 717.67 | -4.36% |
| 28.02.2018 | 812 561.09 | 795 275.78 | 17 285.30 | 2.17% | 869 709.63 | -57 148.54 | -6.57% |
| 31.01.2018 | 795 275.78 | 784 229.70 | 11 046.08 | 1.41% | 878 146.66 | -82 870.87 | -9.44% |
| 31.12.2017 | 784 229.70 | 830 550.57 | -46 320.87 | -5.58% | 899 155.94 | - 114 926.24 | -12.78% |
| 30.11.2017 | 830 550.57 | 823 391.87 | 7 158.70 | 0.87% | 903 744.94 | -73 194.37 | -8.10% |
| 31.10.2017 | 823 391.87 | 813 890.11 | 9 501.76 | 1.17% | 906 748.04 | -83 356.17 | -9.19% |
| 30.09.2017 | 813 890.11 | 812 745.81 | 1 144.30 | 0.14% | 934 352.66 | - 120 462.55 | -12.89% |
| 31.08.2017 | 812 745.81 | 814 640.19 | -1 894.39 | -0.23% | 951 378.70 | - 138 632.89 | -14.57% |
| 31.07.2017 | 814 640.19 | 824 506.87 | -9 866.67 | -1.20% | 960 790.77 | - 146 150.58 | -15.21% |
| 30.06.2017 | 824 506.87 | 831 957.07 | -7 450.20 | -0.90% | 962 345.82 | - 137 838.96 | -14.32% |
| 31.05.2017 | 831 957.07 | 845 649.88 | -13 692.81 | -1.62% | 973 821.53 | - 141 864.46 | -14.57% |
| 30.04.2017 | 845 649.88 | 864 654.31 | -19 004.42 | -2.20% | 969 799.79 | - 124 149.90 | -12.80% |
| 31.03.2017 | 864 654.31 | 869 709.63 | -5 055.32 | -0.58% | 968 249.77 | - 103 595.46 | -10.70% |
| 28.02.2017 | 869 709.63 | 878 146.66 | -8 437.03 | -0.96% | 974 831.51 | - 105 121.88 | -10.78% |
| 31.01.2017 | 878 146.66 | 899 155.94 | -21 009.28 | -2.34% | 982 142.33 | - 103 995.67 | -10.59% |
| 31.12.2016 | 899 155.94 | 903 744.94 | -4 589.00 | -0.51% | 975 492.19 | -76 336.26 | -7.83% |
| 30.11.2016 | 903 744.94 | 906 748.04 | -3 003.10 | -0.33% | 992 297.05 | -88 552.11 | -8.92% |
| 31.10.2016 | 906 748.04 | 934 352.66 | -27 604.62 | -2.95% | 988 854.31 | -82 106.27 | -8.30% |
| 30.09.2016 | 934 352.66 | 951 378.70 | -17 026.04 | -1.79% | 1 018 481.16 | -84 128.49 | -8.26% |
| 31.08.2016 | 951 378.70 | 960 790.77 | -9 412.07 | -0.98% | 1 059 091.30 | - 107 712.61 | -10.17% |
| 31.07.2016 | 960 790.77 | 962 345.82 | -1 555.05 | -0.16% | 1 057 769.01 | -96 978.24 | -9.17% |
| 30.06.2016 | 962 345.82 | 973 821.53 | -11 475.70 | -1.18% | 1 055 963.00 | -93 617.18 | -8.87% |
| 31.05.2016 | 973 821.53 | 969 799.79 | 4 021.74 | 0.41% | 1 044 113.60 | -70 292.07 | -6.73% |
| 30.04.2016 | 969 799.79 | 968 249.77 | 1 550.02 | 0.16% | 1 030 226.75 | -60 426.97 | -5.87% |
| 31.03.2016 | 968 249.77 | 974 831.51 | -6 581.74 | -0.68% | 1 055 706.69 | -87 456.92 | -8.28% |
| 29.02.2016 | 974 831.51 | 982 142.33 | -7 310.82 | -0.74% | 1 052 840.06 | -78 008.55 | -7.41% |
| 31.01.2016 | 982 142.33 | 975 492.19 | 6 650.14 | 0.68% | 1 031 896.57 | -49 754.24 | -4.82% |
| 31.12.2015 | 975 492.19 | 992 297.05 | -16 804.86 | -1.69% | 1 043 340.55 | -67 848.36 | -6.50% |
| 30.11.2015 | 992 297.05 | 988 854.31 | 3 442.74 | 0.35% | 1 040 924.10 | -48 627.05 | -4.67% |
| 31.10.2015 | 988 854.31 | 1 018 481.16 | -29 626.85 | -2.91% | 1 047 408.45 | -58 554.14 | -5.59% |
| 30.09.2015 | 1 018 481.16 | 1 059 091.30 | -40 610.15 | -3.83% | 1 025 384.41 | -6 903.26 | -0.67% |
| 31.08.2015 | 1 059 091.30 | 1 057 769.01 | 1 322.30 | 0.12% | 1 019 227.83 | 39 863.47 | 3.91% |
| 31.07.2015 | 1 057 769.01 | 1 055 963.00 | 1 806.01 | 0.17% | 1 018 432.36 | 39 336.65 | 3.86% |
| 30.06.2015 | 1 055 963.00 | 1 044 113.60 | 11 849.40 | 1.13% | 1 017 778.43 | 38 184.57 | 3.75% |
| 31.05.2015 | 1 044 113.60 | 1 030 226.75 | 13 886.84 | 1.35% | 1 002 416.15 | 41 697.44 | 4.16% |
| 30.04.2015 | 1 030 226.75 | 1 055 706.69 | -25 479.94 | -2.41% | 986 035.16 | 44 191.60 | 4.48% |
| 31.03.2015 | 1 055 706.69 | 1 052 840.06 | 2 866.62 | 0.27% | 974 948.96 | 80 757.73 | 8.28% |
| 28.02.2015 | 1 052 840.06 | 1 031 896.57 | 20 943.50 | 2.03% | 991 556.29 | 61 283.78 | 6.18% |
| 31.01.2015 | 1 031 896.57 | 1 043 340.55 | -11 443.98 | -1.10% | 985 814.77 | 46 081.80 | 4.67% |
| 31.12.2014 | 1 043 340.55 | 1 040 924.10 | 2 416.44 | 0.23% | 971 758.23 | 71 582.31 | 7.37% |
| 30.11.2014 | 1 040 924.10 | 1 047 408.45 | -6 484.34 | -0.62% | 988 386.02 | 52 538.08 | 5.32% |
| 31.10.2014 | 1 047 408.45 | 1 025 384.41 | 22 024.03 | 2.15% | 988 755.60 | 58 652.85 | 5.93% |
| 30.09.2014 | 1 025 384.41 | 1 019 227.83 | 6 156.58 | 0.60% | 973 076.01 | 52 308.40 | 5.38% |
| 31.08.2014 | 1 019 227.83 | 1 018 432.36 | 795.47 | 0.08% | 988 804.62 | 30 423.21 | 3.08% |
| 31.07.2014 | 1 018 432.36 | 1 017 778.43 | 653.93 | 0.06% | 984 913.40 | 33 518.96 | 3.40% |
| 30.06.2014 | 1 017 778.43 | 1 002 416.15 | 15 362.27 | 1.53% | 973 715.82 | 44 062.60 | 4.53% |
| 31.05.2014 | 1 002 416.15 | 986 035.16 | 16 381.00 | 1.66% | 1 006 082.37 | -3 666.21 | -0.36% |
| 30.04.2014 | 986 035.16 | 974 948.96 | 11 086.20 | 1.14% | 1 012 322.90 | -26 287.74 | -2.60% |
| 31.03.2014 | 974 948.96 | 991 556.29 | -16 607.33 | -1.67% | 1 007 872.37 | -32 923.41 | -3.27% |
| 28.02.2014 | 991 556.29 | 985 814.77 | 5 741.52 | 0.58% | 992 216.79 | - 660.50 | -0.07% |
| 31.01.2014 | 985 814.77 | 971 758.23 | 14 056.53 | 1.45% | 989 748.40 | -3 933.63 | -0.40% |
| 31.12.2013 | 971 758.23 | 988 386.02 | -16 627.79 | -1.68% | 965 011.66 | 6 746.57 | 0.70% |
| 30.11.2013 | 988 386.02 | 988 755.60 | - 369.58 | -0.04% | 961 197.27 | 27 188.75 | 2.83% |
| 31.10.2013 | 988 755.60 | 973 076.01 | 15 679.59 | 1.61% | 952 916.29 | 35 839.31 | 3.76% |
| 30.09.2013 | 973 076.01 | 988 804.62 | -15 728.61 | -1.59% | 965 186.02 | 7 889.99 | 0.82% |
| 31.08.2013 | 988 804.62 | 984 913.40 | 3 891.22 | 0.40% | 948 641.05 | 40 163.57 | 4.23% |
| 31.07.2013 | 984 913.40 | 973 715.82 | 11 197.58 | 1.15% | 941 976.10 | 42 937.30 | 4.56% |
| 30.06.2013 | 973 715.82 | 1 006 082.37 | -32 366.54 | -3.22% | 931 405.40 | 42 310.43 | 4.54% |
| 31.05.2013 | 1 006 082.37 | 1 012 322.90 | -6 240.53 | -0.62% | 925 371.92 | 80 710.45 | 8.72% |
| 30.04.2013 | 1 012 322.90 | 1 007 872.37 | 4 450.53 | 0.44% | 906 681.95 | 105 640.95 | 11.65% |
| 31.03.2013 | 1 007 872.37 | 992 216.79 | 15 655.58 | 1.58% | 914 765.91 | 93 106.47 | 10.18% |
| 28.02.2013 | 992 216.79 | 989 748.40 | 2 468.40 | 0.25% | 890 042.85 | 102 173.94 | 11.48% |
| 31.01.2013 | 989 748.40 | 965 011.66 | 24 736.74 | 2.56% | 875 716.24 | 114 032.15 | 13.02% |
| 31.12.2012 | 965 011.66 | 961 197.27 | 3 814.39 | 0.40% | 851 517.68 | 113 493.98 | 13.33% |
| 30.11.2012 | 961 197.27 | 952 916.29 | 8 280.98 | 0.87% | 855 628.74 | 105 568.53 | 12.34% |
| 31.10.2012 | 952 916.29 | 965 186.02 | -12 269.73 | -1.27% | 845 485.25 | 107 431.04 | 12.71% |
| 30.09.2012 | 965 186.02 | 948 641.05 | 16 544.97 | 1.74% | 861 045.87 | 104 140.15 | 12.09% |
| 31.08.2012 | 948 641.05 | 941 976.10 | 6 664.95 | 0.71% | 844 093.62 | 104 547.43 | 12.39% |
| 31.07.2012 | 941 976.10 | 931 405.40 | 10 570.70 | 1.13% | 825 899.73 | 116 076.38 | 14.05% |
| 30.06.2012 | 931 405.40 | 925 371.92 | 6 033.48 | 0.65% | 827 503.90 | 103 901.50 | 12.56% |
| 31.05.2012 | 925 371.92 | 906 681.95 | 18 689.97 | 2.06% | 822 547.00 | 102 824.92 | 12.50% |
| 30.04.2012 | 906 681.95 | 914 765.91 | -8 083.95 | -0.88% | 803 181.61 | 103 500.34 | 12.89% |
| 31.03.2012 | 914 765.91 | 890 042.85 | 24 723.05 | 2.78% | 832 606.61 | 82 159.30 | 9.87% |
| 29.02.2012 | 890 042.85 | 875 716.24 | 14 326.61 | 1.64% | 810 948.94 | 79 093.92 | 9.75% |
| 31.01.2012 | 875 716.24 | 851 517.68 | 24 198.57 | 2.84% | 791 322.41 | 84 393.84 | 10.66% |
| 31.12.2011 | 851 517.68 | 855 628.74 | -4 111.06 | -0.48% | 774 645.84 | 76 871.84 | 9.92% |
| 30.11.2011 | 855 628.74 | 845 485.25 | 10 143.49 | 1.20% | 767 742.11 | 87 886.62 | 11.45% |
| 31.10.2011 | 845 485.25 | 861 045.87 | -15 560.62 | -1.81% | 768 417.23 | 77 068.02 | 10.03% |
| 30.09.2011 | 861 045.87 | 844 093.62 | 16 952.25 | 2.01% | 816 624.44 | 44 421.43 | 5.44% |
| 31.08.2011 | 844 093.62 | 825 899.73 | 18 193.90 | 2.20% | 798 634.60 | 45 459.02 | 5.69% |
| 31.07.2011 | 825 899.73 | 827 503.90 | -1 604.17 | -0.19% | 790 822.72 | 35 077.01 | 4.44% |
| 30.06.2011 | 827 503.90 | 822 547.00 | 4 956.90 | 0.60% | 761 239.77 | 66 264.13 | 8.70% |
| 31.05.2011 | 822 547.00 | 803 181.61 | 19 365.39 | 2.41% | 754 222.67 | 68 324.33 | 9.06% |
| 30.04.2011 | 803 181.61 | 832 606.61 | -29 424.99 | -3.53% | 750 176.12 | 53 005.49 | 7.07% |
| 31.03.2011 | 832 606.61 | 810 948.94 | 21 657.67 | 2.67% | 749 320.20 | 83 286.40 | 11.11% |
| 28.02.2011 | 810 948.94 | 791 322.41 | 19 626.53 | 2.48% | 728 941.37 | 82 007.57 | 11.25% |
| 31.01.2011 | 791 322.41 | 774 645.84 | 16 676.57 | 2.15% | 725 590.72 | 65 731.68 | 9.06% |
| 31.12.2010 | 774 645.84 | 767 742.11 | 6 903.73 | 0.90% | 732 425.41 | 42 220.43 | 5.76% |
| 30.11.2010 | 767 742.11 | 768 417.23 | - 675.11 | -0.09% | 732 435.05 | 35 307.06 | 4.82% |
| 31.10.2010 | 768 417.23 | 816 624.44 | -48 207.22 | -5.90% | 762 923.53 | 5 493.70 | 0.72% |
| 30.09.2010 | 816 624.44 | 798 634.60 | 17 989.84 | 2.25% | 731 435.03 | 85 189.41 | 11.65% |
| 31.08.2010 | 798 634.60 | 790 822.72 | 7 811.89 | 0.99% | 709 131.93 | 89 502.68 | 12.62% |
| 31.07.2010 | 790 822.72 | 761 239.77 | 29 582.95 | 3.89% | 703 430.61 | 87 392.11 | 12.42% |
| 30.06.2010 | 761 239.77 | 754 222.67 | 7 017.10 | 0.93% | 707 273.60 | 53 966.17 | 7.63% |
| 31.05.2010 | 754 222.67 | 750 176.12 | 4 046.55 | 0.54% | 688 931.09 | 65 291.59 | 9.48% |
| 30.04.2010 | 750 176.12 | 749 320.20 | 855.92 | 0.11% | 658 709.91 | 91 466.21 | 13.89% |
| 31.03.2010 | 749 320.20 | 728 941.37 | 20 378.83 | 2.80% | 640 060.56 | 109 259.65 | 17.07% |
| 28.02.2010 | 728 941.37 | 725 590.72 | 3 350.64 | 0.46% | 638 656.31 | 90 285.06 | 14.14% |
| 31.01.2010 | 725 590.72 | 732 425.41 | -6 834.69 | -0.93% | 652 466.64 | 73 124.09 | 11.21% |
| 31.12.2009 | 732 425.41 | 732 435.05 | -9.64 | -0.00% | 634 904.93 | 97 520.48 | 15.36% |
| 30.11.2009 | 732 435.05 | 762 923.53 | -30 488.48 | -4.00% | 624 368.70 | 108 066.36 | 17.31% |
| 31.10.2009 | 762 923.53 | 731 435.03 | 31 488.50 | 4.30% | 578 362.33 | 184 561.20 | 31.91% |
| 30.09.2009 | 731 435.03 | 709 131.93 | 22 303.11 | 3.15% | 536 689.81 | 194 745.22 | 36.29% |
| 31.08.2009 | 709 131.93 | 703 430.61 | 5 701.31 | 0.81% | 544 400.36 | 164 731.57 | 30.26% |
| 31.07.2009 | 703 430.61 | 707 273.60 | -3 842.99 | -0.54% | 537 542.78 | 165 887.83 | 30.86% |
| 30.06.2009 | 707 273.60 | 688 931.09 | 18 342.52 | 2.66% | 531 402.41 | 175 871.19 | 33.10% |
| 31.05.2009 | 688 931.09 | 658 709.91 | 30 221.17 | 4.59% | 525 464.56 | 163 466.53 | 31.11% |
| 30.04.2009 | 658 709.91 | 640 060.56 | 18 649.36 | 2.91% | 524 922.70 | 133 787.21 | 25.49% |
| 31.03.2009 | 640 060.56 | 638 656.31 | 1 404.24 | 0.22% | 529 082.01 | 110 978.54 | 20.98% |
| 28.02.2009 | 638 656.31 | 652 466.64 | -13 810.32 | -2.12% | 539 239.61 | 99 416.70 | 18.44% |
| 31.01.2009 | 652 466.64 | 634 904.93 | 17 561.70 | 2.77% | 571 531.14 | 80 935.49 | 14.16% |
| 31.12.2008 | 634 904.93 | 624 368.70 | 10 536.24 | 1.69% | 586 241.02 | 48 663.92 | 8.30% |
| 30.11.2008 | 624 368.70 | 578 362.33 | 46 006.37 | 7.95% | 558 014.09 | 66 354.61 | 11.89% |
| 31.10.2008 | 578 362.33 | 536 689.81 | 41 672.51 | 7.76% | 545 001.02 | 33 361.31 | 6.12% |
| 30.09.2008 | 536 689.81 | 544 400.36 | -7 710.55 | -1.42% | 535 854.33 | 835.49 | 0.16% |
| 31.08.2008 | 544 400.36 | 537 542.78 | 6 857.58 | 1.28% | 535 647.74 | 8 752.62 | 1.63% |
| 31.07.2008 | 537 542.78 | 531 402.41 | 6 140.36 | 1.16% | 538 544.91 | -1 002.13 | -0.19% |
| 30.06.2008 | 531 402.41 | 525 464.56 | 5 937.85 | 1.13% | 537 776.06 | -6 373.65 | -1.19% |
| 31.05.2008 | 525 464.56 | 524 922.70 | 541.85 | 0.10% | 527 480.34 | -2 015.78 | -0.38% |
| 30.04.2008 | 524 922.70 | 529 082.01 | -4 159.31 | -0.79% | 525 988.10 | -1 065.39 | -0.20% |
| 31.03.2008 | 529 082.01 | 539 239.61 | -10 157.60 | -1.88% | 515 008.39 | 14 073.62 | 2.73% |
| 29.02.2008 | 539 239.61 | 571 531.14 | -32 291.53 | -5.65% | 529 623.25 | 9 616.36 | 1.82% |
| 31.01.2008 | 571 531.14 | 586 241.02 | -14 709.87 | -2.51% | 518 850.61 | 52 680.54 | 10.15% |
| 31.12.2007 | 586 241.02 | 558 014.09 | 28 226.93 | 5.06% | 506 397.89 | 79 843.12 | 15.77% |
| 30.11.2007 | 558 014.09 | 545 001.02 | 13 013.07 | 2.39% | 486 748.42 | 71 265.66 | 14.64% |
| 31.10.2007 | 545 001.02 | 535 854.33 | 9 146.69 | 1.71% | 465 720.08 | 79 280.94 | 17.02% |
| 30.09.2007 | 535 854.33 | 535 647.74 | 206.58 | 0.04% | 469 377.71 | 66 476.61 | 14.16% |
| 31.08.2007 | 535 647.74 | 538 544.91 | -2 897.16 | -0.54% | 469 884.97 | 65 762.77 | 14.00% |
| 31.07.2007 | 538 544.91 | 537 776.06 | 768.85 | 0.14% | 469 199.36 | 69 345.54 | 14.78% |
| 30.06.2007 | 537 776.06 | 527 480.34 | 10 295.72 | 1.95% | 464 163.97 | 73 612.09 | 15.86% |
| 31.05.2007 | 527 480.34 | 525 988.10 | 1 492.24 | 0.28% | 458 776.48 | 68 703.86 | 14.98% |
| 30.04.2007 | 525 988.10 | 515 008.39 | 10 979.71 | 2.13% | 447 645.02 | 78 343.08 | 17.50% |
| 31.03.2007 | 515 008.39 | 529 623.25 | -14 614.86 | -2.76% | 439 414.08 | 75 594.32 | 17.20% |
| 28.02.2007 | 529 623.25 | 518 850.61 | 10 772.65 | 2.08% | 443 375.53 | 86 247.72 | 19.45% |
| 31.01.2007 | 518 850.61 | 506 397.89 | 12 452.72 | 2.46% | 435 884.10 | 82 966.51 | 19.03% |
| 31.12.2006 | 506 397.89 | 486 748.42 | 19 649.47 | 4.04% | 442 790.21 | 63 607.68 | 14.37% |
| 30.11.2006 | 486 748.42 | 465 720.08 | 21 028.35 | 4.52% | 436 549.89 | 50 198.53 | 11.50% |
| 31.10.2006 | 465 720.08 | 469 377.71 | -3 657.64 | -0.78% | 429 811.99 | 35 908.08 | 8.35% |
| 30.09.2006 | 469 377.71 | 469 884.97 | - 507.26 | -0.11% | 426 788.34 | 42 589.38 | 9.98% |
| 31.08.2006 | 469 884.97 | 469 199.36 | 685.61 | 0.15% | 425 129.85 | 44 755.12 | 10.53% |
| 31.07.2006 | 469 199.36 | 464 163.97 | 5 035.39 | 1.08% | 429 958.41 | 39 240.96 | 9.13% |
| 30.06.2006 | 464 163.97 | 458 776.48 | 5 387.49 | 1.17% | 434 027.45 | 30 136.52 | 6.94% |
| 31.05.2006 | 458 776.48 | 447 645.02 | 11 131.47 | 2.49% | 417 242.02 | 41 534.46 | 9.95% |
| 30.04.2006 | 447 645.02 | 439 414.08 | 8 230.94 | 1.87% | 415 080.86 | 32 564.16 | 7.85% |
| 31.03.2006 | 439 414.08 | 443 375.53 | -3 961.46 | -0.89% | 414 682.60 | 24 731.48 | 5.96% |
| 28.02.2006 | 443 375.53 | 435 884.10 | 7 491.43 | 1.72% | 413 222.81 | 30 152.72 | 7.30% |
| 31.01.2006 | 435 884.10 | 442 790.21 | -6 906.11 | -1.56% | 416 666.67 | 19 217.42 | 4.61% |
| 31.12.2005 | 442 790.21 | 436 549.89 | 6 240.32 | 1.43% | 418 392.97 | 24 397.25 | 5.83% |
| 30.11.2005 | 436 549.89 | 429 811.99 | 6 737.90 | 1.57% | 431 176.53 | 5 373.36 | 1.25% |
| 31.10.2005 | 429 811.99 | 426 788.34 | 3 023.66 | 0.71% | 436 610.28 | -6 798.28 | -1.56% |
| 30.09.2005 | 426 788.34 | 425 129.85 | 1 658.48 | 0.39% | 449 721.28 | -22 932.94 | -5.10% |
| 31.08.2005 | 425 129.85 | 429 958.41 | -4 828.56 | -1.12% | 468 908.25 | -43 778.40 | -9.34% |
| 31.07.2005 | 429 958.41 | 434 027.45 | -4 069.04 | -0.94% | 468 105.66 | -38 147.25 | -8.15% |
| 30.06.2005 | 434 027.45 | 417 242.02 | 16 785.43 | 4.02% | 472 583.86 | -38 556.40 | -8.16% |
| 31.05.2005 | 417 242.02 | 415 080.86 | 2 161.16 | 0.52% | 465 291.03 | -48 049.01 | -10.33% |
| 30.04.2005 | 415 080.86 | 414 682.60 | 398.26 | 0.10% | 463 613.46 | -48 532.60 | -10.47% |
| 31.03.2005 | 414 682.60 | 413 222.81 | 1 459.79 | 0.35% | 454 727.80 | -40 045.20 | -8.81% |
| 28.02.2005 | 413 222.81 | 416 666.67 | -3 443.86 | -0.83% | 458 297.38 | -45 074.57 | -9.84% |
| 31.01.2005 | 416 666.67 | 418 392.97 | -1 726.29 | -0.41% | 457 015.12 | -40 348.45 | -8.83% |
| 31.12.2004 | 418 392.97 | 431 176.53 | -12 783.57 | -2.96% | 385 052.71 | 33 340.25 | 8.66% |
| 30.11.2004 | 431 176.53 | 436 610.28 | -5 433.74 | -1.24% | 382 666.10 | 48 510.43 | 12.68% |
| 31.10.2004 | 436 610.28 | 449 721.28 | -13 111.00 | -2.92% | 376 871.69 | 59 738.58 | 15.85% |
| 30.09.2004 | 449 721.28 | 468 908.25 | -19 186.98 | -4.09% | 367 779.96 | 81 941.32 | 22.28% |
| 31.08.2004 | 468 908.25 | 468 105.66 | 802.59 | 0.17% | 367 226.72 | 101 681.53 | 27.69% |
| 31.07.2004 | 468 105.66 | 472 583.86 | -4 478.19 | -0.95% | 359 393.84 | 108 711.82 | 30.25% |
| 30.06.2004 | 472 583.86 | 465 291.03 | 7 292.82 | 1.57% | 353 261.88 | 119 321.98 | 33.78% |
| 31.05.2004 | 465 291.03 | 463 613.46 | 1 677.58 | 0.36% | 336 144.35 | 129 146.69 | 38.42% |
| 30.04.2004 | 463 613.46 | 454 727.80 | 8 885.66 | 1.95% | 331 358.23 | 132 255.23 | 39.91% |
| 31.03.2004 | 454 727.80 | 458 297.38 | -3 569.58 | -0.78% | 325 469.75 | 129 258.06 | 39.71% |
| 29.02.2004 | 458 297.38 | 457 015.12 | 1 282.26 | 0.28% | 314 315.31 | 143 982.07 | 45.81% |
| 31.01.2004 | 457 015.12 | 385 052.71 | 71 962.41 | 18.69% | 304 422.39 | 152 592.73 | 50.13% |
| 31.12.2003 | 385 052.71 | 382 666.10 | 2 386.61 | 0.62% | 303 256.16 | 81 796.55 | 26.97% |
| 30.11.2003 | 382 666.10 | 376 871.69 | 5 794.41 | 1.54% | 312 980.85 | 69 685.25 | 22.27% |
| 31.10.2003 | 376 871.69 | 367 779.96 | 9 091.73 | 2.47% | 304 044.99 | 72 826.70 | 23.95% |
| 30.09.2003 | 367 779.96 | 367 226.72 | 553.24 | 0.15% | 306 089.64 | 61 690.31 | 20.15% |
| 31.08.2003 | 367 226.72 | 359 393.84 | 7 832.88 | 2.18% | 298 950.40 | 68 276.32 | 22.84% |
| 31.07.2003 | 359 393.84 | 353 261.88 | 6 131.97 | 1.74% | 288 340.28 | 71 053.56 | 24.64% |
| 30.06.2003 | 353 261.88 | 336 144.35 | 17 117.53 | 5.09% | 285 068.71 | 68 193.17 | 23.92% |
| 31.05.2003 | 336 144.35 | 331 358.23 | 4 786.11 | 1.44% | 276 869.27 | 59 275.07 | 21.41% |
| 30.04.2003 | 331 358.23 | 325 469.75 | 5 888.49 | 1.81% | 276 796.26 | 54 561.97 | 19.71% |
| 31.03.2003 | 325 469.75 | 314 315.31 | 11 154.43 | 3.55% | 268 743.75 | 56 725.99 | 21.11% |
| 28.02.2003 | 314 315.31 | 304 422.39 | 9 892.92 | 3.25% | 282 354.97 | 31 960.35 | 11.32% |
| 31.01.2003 | 304 422.39 | 303 256.16 | 1 166.22 | 0.38% | 280 411.43 | 24 010.96 | 8.56% |
| 31.12.2002 | 303 256.16 | 312 980.85 | -9 724.69 | -3.11% | - | - | - |
| 30.11.2002 | 312 980.85 | 304 044.99 | 8 935.86 | 2.94% | - | - | - |
| 31.10.2002 | 304 044.99 | 306 089.64 | -2 044.65 | -0.67% | - | - | - |
| 30.09.2002 | 306 089.64 | 298 950.40 | 7 139.25 | 2.39% | - | - | - |
| 31.08.2002 | 298 950.40 | 288 340.28 | 10 610.12 | 3.68% | - | - | - |
| 31.07.2002 | 288 340.28 | 285 068.71 | 3 271.57 | 1.15% | - | - | - |
| 30.06.2002 | 285 068.71 | 276 869.27 | 8 199.43 | 2.96% | - | - | - |
| 31.05.2002 | 276 869.27 | 276 796.26 | 73.02 | 0.03% | - | - | - |
| 30.04.2002 | 276 796.26 | 268 743.75 | 8 052.51 | 3.00% | - | - | - |
| 31.03.2002 | 268 743.75 | 282 354.97 | -13 611.21 | -4.82% | - | - | - |
| 28.02.2002 | 282 354.97 | 280 411.43 | 1 943.54 | 0.69% | - | - | - |
| 31.01.2002 | 280 411.43 | - | - | - | - | - | - |
Graf jako obrázek

Podobné sestavy
Aplikace Ekonomika ČNB ze sekce makroekonomika zobrazuje časové řady hlavních makroekonomických údajů z ekonomiky ČR. Najdete zde přes 10.000 grafů různých hodnot od úrokových sazeb, přes statistiky státního rozpočtu, statistiky ČNB a data zpracovávaná ČSÚ. Data jsou k dispozici obvykle za posledních více než 20 let, od prosince roku 1992. Zdroj dat: ČNB ARAD

