Shares and other equity (AF.51) (Financial assets, stocks, Total economy) - ekonomika ČNB
Aktualizace dat Shares and other equity (AF.51) (Financial assets, stocks, Total economy) v této aplikaci skončila 30.6.2023. Aktualizovná data časových řad najdete na stránkách nové aplikace z dat ARAD ČNB
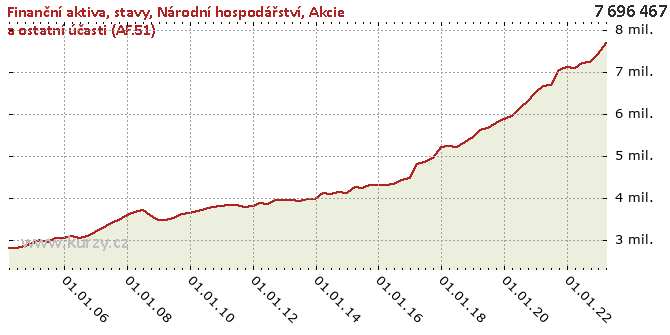
Graf hodnot, Financial assets, stocks, Total economy
Meziroční srovnání
Minima a maxima
| Typ | Období | Hodnota |
|---|---|---|
| Max | 31.03.2020 | 6 043 453.00 |
| Min | 31.03.2004 | 2 792 889.00 |
Historické hodnoty
| Období | Hodnota | Předchozí | Rozdíl | Změna | Před rokem | Rozdíl | Změna |
|---|---|---|---|---|---|---|---|
| 31.03.2020 | 6 043 453.00 | 5 932 865.00 | 110 588.00 | 1.86% | 5 605 580.00 | 437 873.00 | 7.81% |
| 31.12.2019 | 5 932 865.00 | 5 789 884.00 | 142 981.00 | 2.47% | 5 438 534.00 | 494 331.00 | 9.09% |
| 30.09.2019 | 5 789 884.00 | 5 661 878.00 | 128 006.00 | 2.26% | 5 332 678.00 | 457 206.00 | 8.57% |
| 30.06.2019 | 5 661 878.00 | 5 605 580.00 | 56 298.00 | 1.00% | 5 204 522.00 | 457 356.00 | 8.79% |
| 31.03.2019 | 5 605 580.00 | 5 438 534.00 | 167 046.00 | 3.07% | 5 225 517.00 | 380 063.00 | 7.27% |
| 31.12.2018 | 5 438 534.00 | 5 332 678.00 | 105 856.00 | 1.99% | 5 198 491.00 | 240 043.00 | 4.62% |
| 30.09.2018 | 5 332 678.00 | 5 204 522.00 | 128 156.00 | 2.46% | 4 951 889.00 | 380 789.00 | 7.69% |
| 30.06.2018 | 5 204 522.00 | 5 225 517.00 | -20 995.00 | -0.40% | 4 850 556.00 | 353 966.00 | 7.30% |
| 31.03.2018 | 5 225 517.00 | 5 198 491.00 | 27 026.00 | 0.52% | 4 805 296.00 | 420 221.00 | 8.74% |
| 31.12.2017 | 5 198 491.00 | 4 951 889.00 | 246 602.00 | 4.98% | 4 482 331.00 | 716 160.00 | 15.98% |
| 30.09.2017 | 4 951 889.00 | 4 850 556.00 | 101 333.00 | 2.09% | 4 433 670.00 | 518 219.00 | 11.69% |
| 30.06.2017 | 4 850 556.00 | 4 805 296.00 | 45 260.00 | 0.94% | 4 325 222.00 | 525 334.00 | 12.15% |
| 31.03.2017 | 4 805 296.00 | 4 482 331.00 | 322 965.00 | 7.21% | 4 300 052.00 | 505 244.00 | 11.75% |
| 31.12.2016 | 4 482 331.00 | 4 433 670.00 | 48 661.00 | 1.10% | 4 309 597.00 | 172 734.00 | 4.01% |
| 30.09.2016 | 4 433 670.00 | 4 325 222.00 | 108 448.00 | 2.51% | 4 312 339.00 | 121 331.00 | 2.81% |
| 30.06.2016 | 4 325 222.00 | 4 300 052.00 | 25 170.00 | 0.59% | 4 240 145.00 | 85 077.00 | 2.01% |
| 31.03.2016 | 4 300 052.00 | 4 309 597.00 | -9 545.00 | -0.22% | 4 247 295.00 | 52 757.00 | 1.24% |
| 31.12.2015 | 4 309 597.00 | 4 312 339.00 | -2 742.00 | -0.06% | 4 119 022.00 | 190 575.00 | 4.63% |
| 30.09.2015 | 4 312 339.00 | 4 240 145.00 | 72 194.00 | 1.70% | 4 144 812.00 | 167 527.00 | 4.04% |
| 30.06.2015 | 4 240 145.00 | 4 247 295.00 | -7 150.00 | -0.17% | 4 098 203.00 | 141 942.00 | 3.46% |
| 31.03.2015 | 4 247 295.00 | 4 119 022.00 | 128 273.00 | 3.11% | 4 120 604.00 | 126 691.00 | 3.07% |
| 31.12.2014 | 4 119 022.00 | 4 144 812.00 | -25 790.00 | -0.62% | 3 965 042.00 | 153 980.00 | 3.88% |
| 30.09.2014 | 4 144 812.00 | 4 098 203.00 | 46 609.00 | 1.14% | 3 976 825.00 | 167 987.00 | 4.22% |
| 30.06.2014 | 4 098 203.00 | 4 120 604.00 | -22 401.00 | -0.54% | 3 919 102.00 | 179 101.00 | 4.57% |
| 31.03.2014 | 4 120 604.00 | 3 965 042.00 | 155 562.00 | 3.92% | 3 957 460.00 | 163 144.00 | 4.12% |
| 31.12.2013 | 3 965 042.00 | 3 976 825.00 | -11 783.00 | -0.30% | 3 955 381.00 | 9 661.00 | 0.24% |
| 30.09.2013 | 3 976 825.00 | 3 919 102.00 | 57 723.00 | 1.47% | 3 939 924.00 | 36 901.00 | 0.94% |
| 30.06.2013 | 3 919 102.00 | 3 957 460.00 | -38 358.00 | -0.97% | 3 849 667.00 | 69 435.00 | 1.80% |
| 31.03.2013 | 3 957 460.00 | 3 955 381.00 | 2 079.00 | 0.05% | 3 875 078.00 | 82 382.00 | 2.13% |
| 31.12.2012 | 3 955 381.00 | 3 939 924.00 | 15 457.00 | 0.39% | 3 794 689.00 | 160 692.00 | 4.23% |
| 30.09.2012 | 3 939 924.00 | 3 849 667.00 | 90 257.00 | 2.34% | 3 769 512.00 | 170 412.00 | 4.52% |
| 30.06.2012 | 3 849 667.00 | 3 875 078.00 | -25 411.00 | -0.66% | 3 821 842.00 | 27 825.00 | 0.73% |
| 31.03.2012 | 3 875 078.00 | 3 794 689.00 | 80 389.00 | 2.12% | 3 824 533.00 | 50 545.00 | 1.32% |
| 31.12.2011 | 3 794 689.00 | 3 769 512.00 | 25 177.00 | 0.67% | 3 806 763.00 | -12 074.00 | -0.32% |
| 30.09.2011 | 3 769 512.00 | 3 821 842.00 | -52 330.00 | -1.37% | 3 769 086.00 | 426.00 | 0.01% |
| 30.06.2011 | 3 821 842.00 | 3 824 533.00 | -2 691.00 | -0.07% | 3 739 298.00 | 82 544.00 | 2.21% |
| 31.03.2011 | 3 824 533.00 | 3 806 763.00 | 17 770.00 | 0.47% | 3 693 262.00 | 131 271.00 | 3.55% |
| 31.12.2010 | 3 806 763.00 | 3 769 086.00 | 37 677.00 | 1.00% | 3 635 064.00 | 171 699.00 | 4.72% |
| 30.09.2010 | 3 769 086.00 | 3 739 298.00 | 29 788.00 | 0.80% | 3 611 825.00 | 157 261.00 | 4.35% |
| 30.06.2010 | 3 739 298.00 | 3 693 262.00 | 46 036.00 | 1.25% | 3 526 710.00 | 212 588.00 | 6.03% |
| 31.03.2010 | 3 693 262.00 | 3 635 064.00 | 58 198.00 | 1.60% | 3 459 789.00 | 233 473.00 | 6.75% |
| 31.12.2009 | 3 635 064.00 | 3 611 825.00 | 23 239.00 | 0.64% | 3 467 693.00 | 167 371.00 | 4.83% |
| 30.09.2009 | 3 611 825.00 | 3 526 710.00 | 85 115.00 | 2.41% | 3 599 158.00 | 12 667.00 | 0.35% |
| 30.06.2009 | 3 526 710.00 | 3 459 789.00 | 66 921.00 | 1.93% | 3 707 759.00 | - 181 049.00 | -4.88% |
| 31.03.2009 | 3 459 789.00 | 3 467 693.00 | -7 904.00 | -0.23% | 3 652 458.00 | - 192 669.00 | -5.28% |
| 31.12.2008 | 3 467 693.00 | 3 599 158.00 | - 131 465.00 | -3.65% | 3 598 321.00 | - 130 628.00 | -3.63% |
| 30.09.2008 | 3 599 158.00 | 3 707 759.00 | - 108 601.00 | -2.93% | 3 463 879.00 | 135 279.00 | 3.91% |
| 30.06.2008 | 3 707 759.00 | 3 652 458.00 | 55 301.00 | 1.51% | 3 391 184.00 | 316 575.00 | 9.34% |
| 31.03.2008 | 3 652 458.00 | 3 598 321.00 | 54 137.00 | 1.50% | 3 271 905.00 | 380 553.00 | 11.63% |
| 31.12.2007 | 3 598 321.00 | 3 463 879.00 | 134 442.00 | 3.88% | 3 185 733.00 | 412 588.00 | 12.95% |
| 30.09.2007 | 3 463 879.00 | 3 391 184.00 | 72 695.00 | 2.14% | 3 088 022.00 | 375 857.00 | 12.17% |
| 30.06.2007 | 3 391 184.00 | 3 271 905.00 | 119 279.00 | 3.65% | 3 044 132.00 | 347 052.00 | 11.40% |
| 31.03.2007 | 3 271 905.00 | 3 185 733.00 | 86 172.00 | 2.70% | 3 088 571.00 | 183 334.00 | 5.94% |
| 31.12.2006 | 3 185 733.00 | 3 088 022.00 | 97 711.00 | 3.16% | 3 037 678.00 | 148 055.00 | 4.87% |
| 30.09.2006 | 3 088 022.00 | 3 044 132.00 | 43 890.00 | 1.44% | 3 031 368.00 | 56 654.00 | 1.87% |
| 30.06.2006 | 3 044 132.00 | 3 088 571.00 | -44 439.00 | -1.44% | 2 933 997.00 | 110 135.00 | 3.75% |
| 31.03.2006 | 3 088 571.00 | 3 037 678.00 | 50 893.00 | 1.68% | 2 999 890.00 | 88 681.00 | 2.96% |
| 31.12.2005 | 3 037 678.00 | 3 031 368.00 | 6 310.00 | 0.21% | 2 922 568.00 | 115 110.00 | 3.94% |
| 30.09.2005 | 3 031 368.00 | 2 933 997.00 | 97 371.00 | 3.32% | 2 857 242.00 | 174 126.00 | 6.09% |
| 30.06.2005 | 2 933 997.00 | 2 999 890.00 | -65 893.00 | -2.20% | 2 798 474.00 | 135 523.00 | 4.84% |
| 31.03.2005 | 2 999 890.00 | 2 922 568.00 | 77 322.00 | 2.65% | 2 792 889.00 | 207 001.00 | 7.41% |
| 31.12.2004 | 2 922 568.00 | 2 857 242.00 | 65 326.00 | 2.29% | - | - | - |
| 30.09.2004 | 2 857 242.00 | 2 798 474.00 | 58 768.00 | 2.10% | - | - | - |
| 30.06.2004 | 2 798 474.00 | 2 792 889.00 | 5 585.00 | 0.20% | - | - | - |
| 31.03.2004 | 2 792 889.00 | - | - | - | - | - | - |
Graf jako obrázek

Podobné sestavy
Aplikace Ekonomika ČNB ze sekce makroekonomika zobrazuje časové řady hlavních makroekonomických údajů z ekonomiky ČR. Najdete zde přes 10.000 grafů různých hodnot od úrokových sazeb, přes statistiky státního rozpočtu, statistiky ČNB a data zpracovávaná ČSÚ. Data jsou k dispozici obvykle za posledních více než 20 let, od prosince roku 1992. Zdroj dat: ČNB ARAD

