Investment fund shares/units (Mixed funds balance sheet) - ekonomika ČNB
Aktualizace dat Investment fund shares/units (Mixed funds balance sheet) v této aplikaci skončila 30.6.2023. Aktualizovná data časových řad najdete na stránkách nové aplikace z dat ARAD ČNB
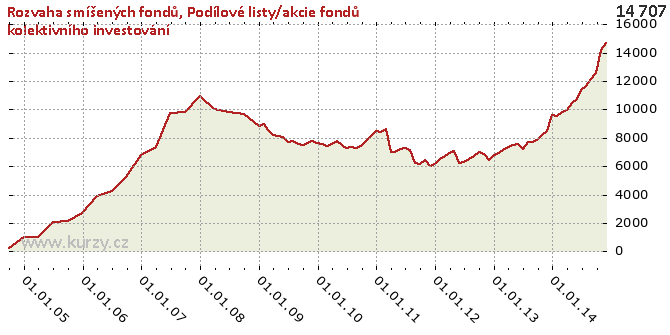
Graf hodnot, Mixed funds balance sheet
Meziroční srovnání
Minima a maxima
| Typ | Období | Hodnota |
|---|---|---|
| Max | 30.11.2014 | 14 707.20 |
| Min | 30.09.2004 | 212.35 |
Historické hodnoty
| Období | Hodnota | Předchozí | Rozdíl | Změna | Před rokem | Rozdíl | Změna |
|---|---|---|---|---|---|---|---|
| 30.11.2014 | 14 707.20 | 14 207.77 | 499.43 | 3.52% | 8 456.28 | 6 250.93 | 73.92% |
| 31.10.2014 | 14 207.77 | 12 584.37 | 1 623.40 | 12.90% | 8 221.55 | 5 986.22 | 72.81% |
| 30.09.2014 | 12 584.37 | 12 166.30 | 418.07 | 3.44% | 7 922.69 | 4 661.67 | 58.84% |
| 31.08.2014 | 12 166.30 | 11 669.13 | 497.16 | 4.26% | 7 733.81 | 4 432.48 | 57.31% |
| 31.07.2014 | 11 669.13 | 11 359.71 | 309.42 | 2.72% | 7 691.56 | 3 977.57 | 51.71% |
| 30.06.2014 | 11 359.71 | 10 748.57 | 611.14 | 5.69% | 7 227.20 | 4 132.51 | 57.18% |
| 31.05.2014 | 10 748.57 | 10 420.89 | 327.68 | 3.14% | 7 575.99 | 3 172.57 | 41.88% |
| 30.04.2014 | 10 420.89 | 9 978.32 | 442.57 | 4.44% | 7 481.63 | 2 939.26 | 39.29% |
| 31.03.2014 | 9 978.32 | 9 843.50 | 134.81 | 1.37% | 7 373.44 | 2 604.88 | 35.33% |
| 28.02.2014 | 9 843.50 | 9 530.85 | 312.65 | 3.28% | 7 133.18 | 2 710.32 | 38.00% |
| 31.01.2014 | 9 530.85 | 9 583.51 | -52.66 | -0.55% | 6 953.35 | 2 577.51 | 37.07% |
| 31.12.2013 | 9 583.51 | 8 456.28 | 1 127.24 | 13.33% | 6 805.52 | 2 777.99 | 40.82% |
| 30.11.2013 | 8 456.28 | 8 221.55 | 234.73 | 2.85% | 6 443.95 | 2 012.33 | 31.23% |
| 31.10.2013 | 8 221.55 | 7 922.69 | 298.85 | 3.77% | 6 850.71 | 1 370.84 | 20.01% |
| 30.09.2013 | 7 922.69 | 7 733.81 | 188.88 | 2.44% | 6 981.81 | 940.88 | 13.48% |
| 31.08.2013 | 7 733.81 | 7 691.56 | 42.25 | 0.55% | 6 730.07 | 1 003.74 | 14.91% |
| 31.07.2013 | 7 691.56 | 7 227.20 | 464.36 | 6.43% | 6 508.61 | 1 182.95 | 18.18% |
| 30.06.2013 | 7 227.20 | 7 575.99 | - 348.79 | -4.60% | 6 275.85 | 951.35 | 15.16% |
| 31.05.2013 | 7 575.99 | 7 481.63 | 94.36 | 1.26% | 6 240.48 | 1 335.51 | 21.40% |
| 30.04.2013 | 7 481.63 | 7 373.44 | 108.19 | 1.47% | 7 065.47 | 416.16 | 5.89% |
| 31.03.2013 | 7 373.44 | 7 133.18 | 240.26 | 3.37% | 6 937.87 | 435.57 | 6.28% |
| 28.02.2013 | 7 133.18 | 6 953.35 | 179.83 | 2.59% | 6 684.74 | 448.44 | 6.71% |
| 31.01.2013 | 6 953.35 | 6 805.52 | 147.83 | 2.17% | 6 495.28 | 458.07 | 7.05% |
| 31.12.2012 | 6 805.52 | 6 443.95 | 361.57 | 5.61% | 6 191.51 | 614.01 | 9.92% |
| 30.11.2012 | 6 443.95 | 6 850.71 | - 406.76 | -5.94% | 5 997.75 | 446.19 | 7.44% |
| 31.10.2012 | 6 850.71 | 6 981.81 | - 131.11 | -1.88% | 6 472.88 | 377.82 | 5.84% |
| 30.09.2012 | 6 981.81 | 6 730.07 | 251.74 | 3.74% | 6 160.28 | 821.54 | 13.34% |
| 31.08.2012 | 6 730.07 | 6 508.61 | 221.46 | 3.40% | 6 240.91 | 489.16 | 7.84% |
| 31.07.2012 | 6 508.61 | 6 275.85 | 232.76 | 3.71% | 7 172.46 | - 663.85 | -9.26% |
| 30.06.2012 | 6 275.85 | 6 240.48 | 35.37 | 0.57% | 7 262.88 | - 987.03 | -13.59% |
| 31.05.2012 | 6 240.48 | 7 065.47 | - 824.99 | -11.68% | 7 200.00 | - 959.52 | -13.33% |
| 30.04.2012 | 7 065.47 | 6 937.87 | 127.60 | 1.84% | 7 019.63 | 45.84 | 0.65% |
| 31.03.2012 | 6 937.87 | 6 684.74 | 253.14 | 3.79% | 7 033.92 | -96.05 | -1.37% |
| 29.02.2012 | 6 684.74 | 6 495.28 | 189.46 | 2.92% | 8 629.80 | -1 945.07 | -22.54% |
| 31.01.2012 | 6 495.28 | 6 191.51 | 303.77 | 4.91% | 8 437.62 | -1 942.35 | -23.02% |
| 31.12.2011 | 6 191.51 | 5 997.75 | 193.75 | 3.23% | 8 514.55 | -2 323.05 | -27.28% |
| 30.11.2011 | 5 997.75 | 6 472.88 | - 475.13 | -7.34% | 8 138.16 | -2 140.41 | -26.30% |
| 31.10.2011 | 6 472.88 | 6 160.28 | 312.60 | 5.07% | 7 804.58 | -1 331.69 | -17.06% |
| 30.09.2011 | 6 160.28 | 6 240.91 | -80.63 | -1.29% | 7 449.21 | -1 288.93 | -17.30% |
| 31.08.2011 | 6 240.91 | 7 172.46 | - 931.55 | -12.99% | 7 317.31 | -1 076.40 | -14.71% |
| 31.07.2011 | 7 172.46 | 7 262.88 | -90.42 | -1.24% | 7 330.89 | - 158.43 | -2.16% |
| 30.06.2011 | 7 262.88 | 7 200.00 | 62.88 | 0.87% | 7 293.20 | -30.32 | -0.42% |
| 31.05.2011 | 7 200.00 | 7 019.63 | 180.37 | 2.57% | 7 517.39 | - 317.38 | -4.22% |
| 30.04.2011 | 7 019.63 | 7 033.92 | -14.29 | -0.20% | 7 789.09 | - 769.46 | -9.88% |
| 31.03.2011 | 7 033.92 | 8 629.80 | -1 595.89 | -18.49% | 7 598.15 | - 564.23 | -7.43% |
| 28.02.2011 | 8 629.80 | 8 437.62 | 192.18 | 2.28% | 7 432.66 | 1 197.14 | 16.11% |
| 31.01.2011 | 8 437.62 | 8 514.55 | -76.93 | -0.90% | 7 579.10 | 858.52 | 11.33% |
| 31.12.2010 | 8 514.55 | 8 138.16 | 376.39 | 4.62% | 7 620.38 | 894.17 | 11.73% |
| 30.11.2010 | 8 138.16 | 7 804.58 | 333.58 | 4.27% | 7 751.43 | 386.73 | 4.99% |
| 31.10.2010 | 7 804.58 | 7 449.21 | 355.37 | 4.77% | 7 668.77 | 135.81 | 1.77% |
| 30.09.2010 | 7 449.21 | 7 317.31 | 131.91 | 1.80% | 7 490.56 | -41.35 | -0.55% |
| 31.08.2010 | 7 317.31 | 7 330.89 | -13.59 | -0.19% | 7 537.84 | - 220.53 | -2.93% |
| 31.07.2010 | 7 330.89 | 7 293.20 | 37.70 | 0.52% | 7 787.13 | - 456.24 | -5.86% |
| 30.06.2010 | 7 293.20 | 7 517.39 | - 224.19 | -2.98% | 7 675.34 | - 382.15 | -4.98% |
| 31.05.2010 | 7 517.39 | 7 789.09 | - 271.70 | -3.49% | 8 035.23 | - 517.84 | -6.44% |
| 30.04.2010 | 7 789.09 | 7 598.15 | 190.94 | 2.51% | 8 140.35 | - 351.26 | -4.32% |
| 31.03.2010 | 7 598.15 | 7 432.66 | 165.49 | 2.23% | 8 169.31 | - 571.15 | -6.99% |
| 28.02.2010 | 7 432.66 | 7 579.10 | - 146.44 | -1.93% | 8 549.33 | -1 116.66 | -13.06% |
| 31.01.2010 | 7 579.10 | 7 620.38 | -41.27 | -0.54% | 8 951.27 | -1 372.17 | -15.33% |
| 31.12.2009 | 7 620.38 | 7 751.43 | - 131.05 | -1.69% | 8 815.46 | -1 195.08 | -13.56% |
| 30.11.2009 | 7 751.43 | 7 668.77 | 82.66 | 1.08% | 9 689.42 | -1 937.99 | -20.00% |
| 31.10.2009 | 7 668.77 | 7 490.56 | 178.21 | 2.38% | 9 689.42 | -2 020.65 | -20.85% |
| 30.09.2009 | 7 490.56 | 7 537.84 | -47.28 | -0.63% | 9 689.42 | -2 198.86 | -22.69% |
| 31.08.2009 | 7 537.84 | 7 787.13 | - 249.29 | -3.20% | 9 832.16 | -2 294.32 | -23.33% |
| 31.07.2009 | 7 787.13 | 7 675.34 | 111.78 | 1.46% | 9 832.16 | -2 045.03 | -20.80% |
| 30.06.2009 | 7 675.34 | 8 035.23 | - 359.88 | -4.48% | 9 832.16 | -2 156.81 | -21.94% |
| 31.05.2009 | 8 035.23 | 8 140.35 | - 105.12 | -1.29% | 10 034.92 | -1 999.69 | -19.93% |
| 30.04.2009 | 8 140.35 | 8 169.31 | -28.95 | -0.35% | 10 034.92 | -1 894.56 | -18.88% |
| 31.03.2009 | 8 169.31 | 8 549.33 | - 380.02 | -4.45% | 10 034.92 | -1 865.61 | -18.59% |
| 28.02.2009 | 8 549.33 | 8 951.27 | - 401.95 | -4.49% | 10 929.54 | -2 380.22 | -21.78% |
| 31.01.2009 | 8 951.27 | 8 815.46 | 135.81 | 1.54% | 10 929.54 | -1 978.27 | -18.10% |
| 31.12.2008 | 8 815.46 | 9 689.42 | - 873.96 | -9.02% | 10 929.54 | -2 114.08 | -19.34% |
| 30.09.2008 | 9 689.42 | 9 832.16 | - 142.74 | -1.45% | 9 816.49 | - 127.06 | -1.29% |
| 30.06.2008 | 9 832.16 | 10 034.92 | - 202.76 | -2.02% | 9 762.01 | 70.14 | 0.72% |
| 31.03.2008 | 10 034.92 | 10 929.54 | - 894.63 | -8.19% | 7 338.06 | 2 696.86 | 36.75% |
| 31.12.2007 | 10 929.54 | 9 816.49 | 1 113.06 | 11.34% | 6 768.57 | 4 160.97 | 61.47% |
| 30.09.2007 | 9 816.49 | 9 762.01 | 54.47 | 0.56% | 5 222.79 | 4 593.70 | 87.95% |
| 30.06.2007 | 9 762.01 | 7 338.06 | 2 423.95 | 33.03% | 4 250.69 | 5 511.33 | 129.66% |
| 31.03.2007 | 7 338.06 | 6 768.57 | 569.49 | 8.41% | 3 889.43 | 3 448.63 | 88.67% |
| 31.12.2006 | 6 768.57 | 5 222.79 | 1 545.79 | 29.60% | 2 706.38 | 4 062.19 | 150.10% |
| 30.09.2006 | 5 222.79 | 4 250.69 | 972.10 | 22.87% | 2 176.24 | 3 046.55 | 139.99% |
| 30.06.2006 | 4 250.69 | 3 889.43 | 361.26 | 9.29% | 2 055.06 | 2 195.62 | 106.84% |
| 31.03.2006 | 3 889.43 | 2 706.38 | 1 183.05 | 43.71% | 1 035.19 | 2 854.24 | 275.72% |
| 31.12.2005 | 2 706.38 | 2 176.24 | 530.14 | 24.36% | 1 035.28 | 1 671.10 | 161.41% |
| 30.09.2005 | 2 176.24 | 2 055.06 | 121.18 | 5.90% | 212.35 | 1 963.89 | 924.83% |
| 30.06.2005 | 2 055.06 | 1 035.19 | 1 019.87 | 98.52% | - | - | - |
| 31.03.2005 | 1 035.19 | 1 035.28 | -0.09 | -0.01% | - | - | - |
| 31.12.2004 | 1 035.28 | 212.35 | 822.93 | 387.53% | - | - | - |
| 30.09.2004 | 212.35 | - | - | - | - | - | - |
Graf jako obrázek

Podobné sestavy
Aplikace Ekonomika ČNB ze sekce makroekonomika zobrazuje časové řady hlavních makroekonomických údajů z ekonomiky ČR. Najdete zde přes 10.000 grafů různých hodnot od úrokových sazeb, přes statistiky státního rozpočtu, statistiky ČNB a data zpracovávaná ČSÚ. Data jsou k dispozici obvykle za posledních více než 20 let, od prosince roku 1992. Zdroj dat: ČNB ARAD

