Mutual funds shares/units issued (Other Funds Balance Sheet) - ekonomika ČNB
Aktualizace dat Mutual funds shares/units issued (Other Funds Balance Sheet) v této aplikaci skončila 30.6.2023. Aktualizovná data časových řad najdete na stránkách nové aplikace z dat ARAD ČNB
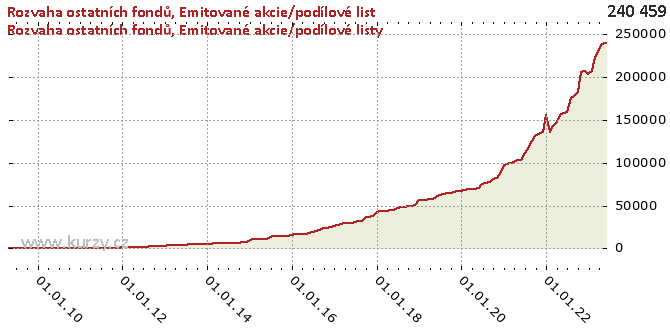
Graf hodnot, Other Funds Balance Sheet
Meziroční srovnání
Minima a maxima
| Typ | Období | Hodnota |
|---|---|---|
| Max | 30.06.2020 | 73 317.43 |
| Min | 30.06.2010 | -0.97 |
Historické hodnoty
| Období | Hodnota | Předchozí | Rozdíl | Změna | Před rokem | Rozdíl | Změna |
|---|---|---|---|---|---|---|---|
| 30.06.2020 | 73 317.43 | 71 048.17 | 2 269.27 | 3.19% | 62 964.62 | 10 352.81 | 16.44% |
| 31.05.2020 | 71 048.17 | 70 691.37 | 356.80 | 0.50% | 59 668.50 | 11 379.67 | 19.07% |
| 30.04.2020 | 70 691.37 | 70 657.34 | 34.02 | 0.05% | 57 924.65 | 12 766.72 | 22.04% |
| 31.03.2020 | 70 657.34 | 68 884.40 | 1 772.94 | 2.57% | 57 575.77 | 13 081.58 | 22.72% |
| 29.02.2020 | 68 884.40 | 68 210.29 | 674.11 | 0.99% | 56 928.23 | 11 956.17 | 21.00% |
| 31.01.2020 | 68 210.29 | 67 628.91 | 581.38 | 0.86% | 56 517.19 | 11 693.10 | 20.69% |
| 31.12.2019 | 67 628.91 | 67 032.90 | 596.01 | 0.89% | 56 001.71 | 11 627.20 | 20.76% |
| 30.11.2019 | 67 032.90 | 66 441.21 | 591.70 | 0.89% | 51 180.85 | 15 852.05 | 30.97% |
| 31.10.2019 | 66 441.21 | 64 911.92 | 1 529.28 | 2.36% | 49 486.42 | 16 954.79 | 34.26% |
| 30.09.2019 | 64 911.92 | 64 373.95 | 537.97 | 0.84% | 49 267.88 | 15 644.05 | 31.75% |
| 31.08.2019 | 64 373.95 | 63 823.28 | 550.67 | 0.86% | 48 210.22 | 16 163.73 | 33.53% |
| 31.07.2019 | 63 823.28 | 62 964.62 | 858.66 | 1.36% | 47 942.85 | 15 880.42 | 33.12% |
| 30.06.2019 | 62 964.62 | 59 668.50 | 3 296.12 | 5.52% | 47 456.29 | 15 508.33 | 32.68% |
| 31.05.2019 | 59 668.50 | 57 924.65 | 1 743.85 | 3.01% | 45 297.68 | 14 370.82 | 31.73% |
| 30.04.2019 | 57 924.65 | 57 575.77 | 348.89 | 0.61% | 44 641.47 | 13 283.18 | 29.76% |
| 31.03.2019 | 57 575.77 | 56 928.23 | 647.54 | 1.14% | 44 218.99 | 13 356.78 | 30.21% |
| 28.02.2019 | 56 928.23 | 56 517.19 | 411.04 | 0.73% | 43 768.02 | 13 160.21 | 30.07% |
| 31.01.2019 | 56 517.19 | 56 001.71 | 515.49 | 0.92% | 43 435.14 | 13 082.05 | 30.12% |
| 31.12.2018 | 56 001.71 | 51 180.85 | 4 820.86 | 9.42% | 42 613.67 | 13 388.04 | 31.42% |
| 30.11.2018 | 51 180.85 | 49 486.42 | 1 694.43 | 3.42% | 37 388.36 | 13 792.49 | 36.89% |
| 31.10.2018 | 49 486.42 | 49 267.88 | 218.54 | 0.44% | 37 087.59 | 12 398.83 | 33.43% |
| 30.09.2018 | 49 267.88 | 48 210.22 | 1 057.65 | 2.19% | 36 922.68 | 12 345.19 | 33.44% |
| 31.08.2018 | 48 210.22 | 47 942.85 | 267.37 | 0.56% | 31 952.81 | 16 257.42 | 50.88% |
| 31.07.2018 | 47 942.85 | 47 456.29 | 486.57 | 1.03% | 31 448.54 | 16 494.32 | 52.45% |
| 30.06.2018 | 47 456.29 | 45 297.68 | 2 158.61 | 4.77% | 30 547.10 | 16 909.19 | 55.35% |
| 31.05.2018 | 45 297.68 | 44 641.47 | 656.20 | 1.47% | 29 866.68 | 15 430.99 | 51.67% |
| 30.04.2018 | 44 641.47 | 44 218.99 | 422.48 | 0.96% | 29 697.75 | 14 943.73 | 50.32% |
| 31.03.2018 | 44 218.99 | 43 768.02 | 450.97 | 1.03% | 29 366.10 | 14 852.89 | 50.58% |
| 28.02.2018 | 43 768.02 | 43 435.14 | 332.88 | 0.77% | 28 228.43 | 15 539.60 | 55.05% |
| 31.01.2018 | 43 435.14 | 42 613.67 | 821.48 | 1.93% | 27 277.51 | 16 157.63 | 59.23% |
| 31.12.2017 | 42 613.67 | 37 388.36 | 5 225.30 | 13.98% | 26 373.55 | 16 240.12 | 61.58% |
| 30.11.2017 | 37 388.36 | 37 087.59 | 300.78 | 0.81% | 24 489.49 | 12 898.88 | 52.67% |
| 31.10.2017 | 37 087.59 | 36 922.68 | 164.90 | 0.45% | 23 975.66 | 13 111.93 | 54.69% |
| 30.09.2017 | 36 922.68 | 31 952.81 | 4 969.88 | 15.55% | 23 539.88 | 13 382.80 | 56.85% |
| 31.08.2017 | 31 952.81 | 31 448.54 | 504.27 | 1.60% | 21 911.92 | 10 040.88 | 45.82% |
| 31.07.2017 | 31 448.54 | 30 547.10 | 901.44 | 2.95% | 20 110.94 | 11 337.60 | 56.38% |
| 30.06.2017 | 30 547.10 | 29 866.68 | 680.41 | 2.28% | 19 712.42 | 10 834.68 | 54.96% |
| 31.05.2017 | 29 866.68 | 29 697.75 | 168.94 | 0.57% | 17 535.54 | 12 331.14 | 70.32% |
| 30.04.2017 | 29 697.75 | 29 366.10 | 331.64 | 1.13% | 16 752.07 | 12 945.68 | 77.28% |
| 31.03.2017 | 29 366.10 | 28 228.43 | 1 137.68 | 4.03% | 16 547.81 | 12 818.29 | 77.46% |
| 28.02.2017 | 28 228.43 | 27 277.51 | 950.91 | 3.49% | 16 445.69 | 11 782.74 | 71.65% |
| 31.01.2017 | 27 277.51 | 26 373.55 | 903.97 | 3.43% | 16 270.82 | 11 006.69 | 67.65% |
| 31.12.2016 | 26 373.55 | 24 489.49 | 1 884.06 | 7.69% | 16 207.12 | 10 166.43 | 62.73% |
| 30.11.2016 | 24 489.49 | 23 975.66 | 513.83 | 2.14% | 14 932.18 | 9 557.31 | 64.00% |
| 31.10.2016 | 23 975.66 | 23 539.88 | 435.78 | 1.85% | 14 756.38 | 9 219.27 | 62.48% |
| 30.09.2016 | 23 539.88 | 21 911.92 | 1 627.96 | 7.43% | 14 614.72 | 8 925.16 | 61.07% |
| 31.08.2016 | 21 911.92 | 20 110.94 | 1 800.99 | 8.96% | 14 352.33 | 7 559.60 | 52.67% |
| 31.07.2016 | 20 110.94 | 19 712.42 | 398.52 | 2.02% | 14 156.56 | 5 954.38 | 42.06% |
| 30.06.2016 | 19 712.42 | 17 535.54 | 2 176.88 | 12.41% | 13 537.65 | 6 174.76 | 45.61% |
| 31.05.2016 | 17 535.54 | 16 752.07 | 783.47 | 4.68% | 11 161.21 | 6 374.33 | 57.11% |
| 30.04.2016 | 16 752.07 | 16 547.81 | 204.26 | 1.23% | 10 953.95 | 5 798.12 | 52.93% |
| 31.03.2016 | 16 547.81 | 16 445.69 | 102.12 | 0.62% | 10 758.32 | 5 789.49 | 53.81% |
| 29.02.2016 | 16 445.69 | 16 270.82 | 174.87 | 1.07% | 10 879.48 | 5 566.21 | 51.16% |
| 31.01.2016 | 16 270.82 | 16 207.12 | 63.70 | 0.39% | 10 641.18 | 5 629.64 | 52.90% |
| 31.12.2015 | 16 207.12 | 14 932.18 | 1 274.94 | 8.54% | 8 582.91 | 7 624.22 | 88.83% |
| 30.11.2015 | 14 932.18 | 14 756.38 | 175.80 | 1.19% | 7 687.13 | 7 245.05 | 94.25% |
| 31.10.2015 | 14 756.38 | 14 614.72 | 141.66 | 0.97% | 7 626.42 | 7 129.97 | 93.49% |
| 30.09.2015 | 14 614.72 | 14 352.33 | 262.39 | 1.83% | 6 709.52 | 7 905.20 | 117.82% |
| 31.08.2015 | 14 352.33 | 14 156.56 | 195.76 | 1.38% | 6 492.24 | 7 860.08 | 121.07% |
| 31.07.2015 | 14 156.56 | 13 537.65 | 618.91 | 4.57% | 6 455.64 | 7 700.92 | 119.29% |
| 30.06.2015 | 13 537.65 | 11 161.21 | 2 376.44 | 21.29% | 6 294.57 | 7 243.09 | 115.07% |
| 31.05.2015 | 11 161.21 | 10 953.95 | 207.26 | 1.89% | 6 186.33 | 4 974.88 | 80.42% |
| 30.04.2015 | 10 953.95 | 10 758.32 | 195.63 | 1.82% | 6 119.98 | 4 833.97 | 78.99% |
| 31.03.2015 | 10 758.32 | 10 879.48 | - 121.16 | -1.11% | 5 992.00 | 4 766.32 | 79.54% |
| 28.02.2015 | 10 879.48 | 10 641.18 | 238.30 | 2.24% | 5 877.56 | 5 001.92 | 85.10% |
| 31.01.2015 | 10 641.18 | 8 582.91 | 2 058.28 | 23.98% | 5 406.84 | 5 234.34 | 96.81% |
| 31.12.2014 | 8 582.91 | 7 687.13 | 895.77 | 11.65% | 5 402.67 | 3 180.24 | 58.86% |
| 30.11.2014 | 7 687.13 | 7 626.42 | 60.72 | 0.80% | 4 664.15 | 3 022.98 | 64.81% |
| 31.10.2014 | 7 626.42 | 6 709.52 | 916.90 | 13.67% | 5 690.93 | 1 935.49 | 34.01% |
| 30.09.2014 | 6 709.52 | 6 492.24 | 217.28 | 3.35% | 5 699.11 | 1 010.41 | 17.73% |
| 31.08.2014 | 6 492.24 | 6 455.64 | 36.60 | 0.57% | 5 448.43 | 1 043.81 | 19.16% |
| 31.07.2014 | 6 455.64 | 6 294.57 | 161.07 | 2.56% | 5 434.73 | 1 020.91 | 18.78% |
| 30.06.2014 | 6 294.57 | 6 186.33 | 108.23 | 1.75% | 4 553.65 | 1 740.92 | 38.23% |
| 31.05.2014 | 6 186.33 | 6 119.98 | 66.35 | 1.08% | 4 421.52 | 1 764.81 | 39.91% |
| 30.04.2014 | 6 119.98 | 5 992.00 | 127.98 | 2.14% | 4 045.20 | 2 074.78 | 51.29% |
| 31.03.2014 | 5 992.00 | 5 877.56 | 114.44 | 1.95% | 3 934.47 | 2 057.53 | 52.29% |
| 28.02.2014 | 5 877.56 | 5 406.84 | 470.72 | 8.71% | 3 904.79 | 1 972.77 | 50.52% |
| 31.01.2014 | 5 406.84 | 5 402.67 | 4.17 | 0.08% | 3 892.08 | 1 514.76 | 38.92% |
| 31.12.2013 | 5 402.67 | 4 664.15 | 738.51 | 15.83% | 3 106.19 | 2 296.47 | 73.93% |
| 30.11.2013 | 4 664.15 | 5 690.93 | -1 026.78 | -18.04% | 2 478.91 | 2 185.24 | 88.15% |
| 31.10.2013 | 5 690.93 | 5 699.11 | -8.18 | -0.14% | 2 471.68 | 3 219.25 | 130.25% |
| 30.09.2013 | 5 699.11 | 5 448.43 | 250.68 | 4.60% | 2 450.93 | 3 248.19 | 132.53% |
| 31.08.2013 | 5 448.43 | 5 434.73 | 13.70 | 0.25% | 2 433.97 | 3 014.46 | 123.85% |
| 31.07.2013 | 5 434.73 | 4 553.65 | 881.08 | 19.35% | 1 665.54 | 3 769.19 | 226.30% |
| 30.06.2013 | 4 553.65 | 4 421.52 | 132.13 | 2.99% | 1 653.11 | 2 900.54 | 175.46% |
| 31.05.2013 | 4 421.52 | 4 045.20 | 376.32 | 9.30% | 1 521.09 | 2 900.43 | 190.68% |
| 30.04.2013 | 4 045.20 | 3 934.47 | 110.73 | 2.81% | 1 515.92 | 2 529.28 | 166.85% |
| 31.03.2013 | 3 934.47 | 3 904.79 | 29.68 | 0.76% | 1 497.71 | 2 436.76 | 162.70% |
| 28.02.2013 | 3 904.79 | 3 892.08 | 12.71 | 0.33% | 1 454.70 | 2 450.10 | 168.43% |
| 31.01.2013 | 3 892.08 | 3 106.19 | 785.89 | 25.30% | 1 441.42 | 2 450.67 | 170.02% |
| 31.12.2012 | 3 106.19 | 2 478.91 | 627.28 | 25.30% | 1 394.13 | 1 712.06 | 122.80% |
| 30.11.2012 | 2 478.91 | 2 471.68 | 7.23 | 0.29% | 226.41 | 2 252.51 | 994.90% |
| 31.10.2012 | 2 471.68 | 2 450.93 | 20.76 | 0.85% | 211.39 | 2 260.29 | 1 069.25% |
| 30.09.2012 | 2 450.93 | 2 433.97 | 16.95 | 0.70% | 180.54 | 2 270.38 | 1 257.52% |
| 31.08.2012 | 2 433.97 | 1 665.54 | 768.43 | 46.14% | 124.37 | 2 309.60 | 1 857.04% |
| 31.07.2012 | 1 665.54 | 1 653.11 | 12.43 | 0.75% | 91.91 | 1 573.63 | 1 712.17% |
| 30.06.2012 | 1 653.11 | 1 521.09 | 132.02 | 8.68% | 89.99 | 1 563.12 | 1 737.00% |
| 31.05.2012 | 1 521.09 | 1 515.92 | 5.17 | 0.34% | 32.78 | 1 488.32 | 4 540.87% |
| 30.04.2012 | 1 515.92 | 1 497.71 | 18.21 | 1.22% | 17.82 | 1 498.10 | 8 408.27% |
| 31.03.2012 | 1 497.71 | 1 454.70 | 43.01 | 2.96% | 15.88 | 1 481.83 | 9 334.38% |
| 29.02.2012 | 1 454.70 | 1 441.42 | 13.28 | 0.92% | 0.00 | 1 454.70 | - |
| 31.01.2012 | 1 441.42 | 1 394.13 | 47.28 | 3.39% | 0.00 | 1 441.42 | - |
| 31.12.2011 | 1 394.13 | 226.41 | 1 167.73 | 515.77% | 0.00 | 1 394.13 | - |
| 30.11.2011 | 226.41 | 211.39 | 15.01 | 7.10% | 0.00 | 226.41 | - |
| 31.10.2011 | 211.39 | 180.54 | 30.85 | 17.09% | 0.05 | 211.34 | 406 421.15% |
| 30.09.2011 | 180.54 | 124.37 | 56.17 | 45.17% | -0.21 | 180.76 | -84 862.44% |
| 31.08.2011 | 124.37 | 91.91 | 32.46 | 35.32% | -0.40 | 124.77 | -31 427.46% |
| 31.07.2011 | 91.91 | 89.99 | 1.92 | 2.13% | -0.20 | 92.11 | -46 285.43% |
| 30.06.2011 | 89.99 | 32.78 | 57.21 | 174.56% | -0.97 | 90.96 | -9 396.49% |
| 31.05.2011 | 32.78 | 17.82 | 14.96 | 83.96% | -0.84 | 33.62 | -3 983.41% |
| 30.04.2011 | 17.82 | 15.88 | 1.94 | 12.23% | -0.71 | 18.53 | -2 602.39% |
| 31.03.2011 | 15.88 | 0.00 | 15.88 | - | 50.42 | -34.54 | -68.51% |
| 28.02.2011 | 0.00 | 0.00 | 0.00 | - | 50.57 | -50.57 | - |
| 31.01.2011 | 0.00 | 0.00 | 0.00 | - | 50.70 | -50.70 | - |
| 31.12.2010 | 0.00 | 0.00 | 0.00 | - | 50.80 | -50.80 | - |
| 30.11.2010 | 0.00 | 0.05 | -0.05 | - | 50.93 | -50.93 | - |
| 31.10.2010 | 0.05 | -0.21 | 0.27 | - 124.41% | 51.05 | -51.00 | -99.90% |
| 30.09.2010 | -0.21 | -0.40 | 0.18 | -46.35% | 50.18 | -50.40 | - 100.42% |
| 31.08.2010 | -0.40 | -0.20 | -0.20 | 99.50% | 50.31 | -50.71 | - 100.79% |
| 31.07.2010 | -0.20 | -0.97 | 0.77 | -79.44% | 50.48 | -50.67 | - 100.39% |
| 30.06.2010 | -0.97 | -0.84 | -0.12 | 14.69% | 50.70 | -51.67 | - 101.91% |
| 31.05.2010 | -0.84 | -0.71 | -0.13 | 18.54% | 50.80 | -51.65 | - 101.66% |
| 30.04.2010 | -0.71 | 50.42 | -51.13 | - 101.41% | 50.99 | -51.70 | - 101.40% |
| 31.03.2010 | 50.42 | 50.57 | -0.15 | -0.30% | - | - | - |
| 28.02.2010 | 50.57 | 50.70 | -0.13 | -0.25% | - | - | - |
| 31.01.2010 | 50.70 | 50.80 | -0.10 | -0.20% | - | - | - |
| 31.12.2009 | 50.80 | 50.93 | -0.13 | -0.25% | - | - | - |
| 30.11.2009 | 50.93 | 51.05 | -0.13 | -0.25% | - | - | - |
| 31.10.2009 | 51.05 | 50.18 | 0.87 | 1.74% | - | - | - |
| 30.09.2009 | 50.18 | 50.31 | -0.13 | -0.25% | - | - | - |
| 31.08.2009 | 50.31 | 50.48 | -0.17 | -0.33% | - | - | - |
| 31.07.2009 | 50.48 | 50.70 | -0.23 | -0.45% | - | - | - |
| 30.06.2009 | 50.70 | 50.80 | -0.10 | -0.19% | - | - | - |
| 31.05.2009 | 50.80 | 50.99 | -0.18 | -0.36% | - | - | - |
| 30.04.2009 | 50.99 | - | - | - | - | - | - |
Graf jako obrázek

Podobné sestavy
Aplikace Ekonomika ČNB ze sekce makroekonomika zobrazuje časové řady hlavních makroekonomických údajů z ekonomiky ČR. Najdete zde přes 10.000 grafů různých hodnot od úrokových sazeb, přes statistiky státního rozpočtu, statistiky ČNB a data zpracovávaná ČSÚ. Data jsou k dispozici obvykle za posledních více než 20 let, od prosince roku 1992. Zdroj dat: ČNB ARAD

