Mutual funds shares/units issued (Real Estate Funds Balance Sheet) - ekonomika ČNB
Aktualizace dat Mutual funds shares/units issued (Real Estate Funds Balance Sheet) v této aplikaci skončila 30.6.2023. Aktualizovná data časových řad najdete na stránkách nové aplikace z dat ARAD ČNB
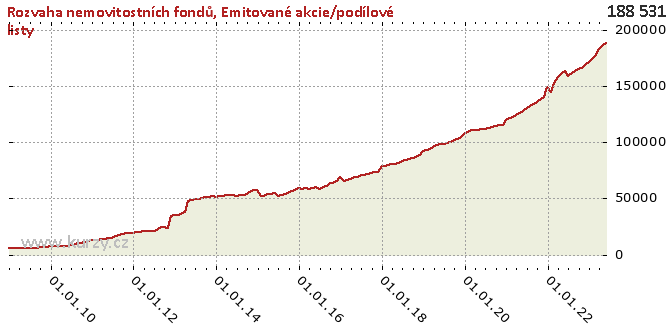
Graf hodnot, Real Estate Funds Balance Sheet
Meziroční srovnání
Minima a maxima
| Typ | Období | Hodnota |
|---|---|---|
| Max | 31.03.2020 | 111 382.37 |
| Min | 30.04.2009 | 5 593.67 |
Historické hodnoty
| Období | Hodnota | Předchozí | Rozdíl | Změna | Před rokem | Rozdíl | Změna |
|---|---|---|---|---|---|---|---|
| 30.06.2020 | 110 838.70 | 111 174.09 | - 335.39 | -0.30% | 98 323.81 | 12 514.88 | 12.73% |
| 31.05.2020 | 111 174.09 | 110 955.61 | 218.48 | 0.20% | 98 211.39 | 12 962.70 | 13.20% |
| 30.04.2020 | 110 955.61 | 111 382.37 | - 426.77 | -0.38% | 97 605.02 | 13 350.58 | 13.68% |
| 31.03.2020 | 111 382.37 | 109 509.83 | 1 872.54 | 1.71% | 96 030.92 | 15 351.45 | 15.99% |
| 29.02.2020 | 109 509.83 | 107 733.78 | 1 776.05 | 1.65% | 94 324.99 | 15 184.84 | 16.10% |
| 31.01.2020 | 107 733.78 | 105 937.52 | 1 796.26 | 1.70% | 93 170.60 | 14 563.17 | 15.63% |
| 31.12.2019 | 105 937.52 | 104 354.00 | 1 583.52 | 1.52% | 91 773.40 | 14 164.12 | 15.43% |
| 30.11.2019 | 104 354.00 | 102 965.62 | 1 388.39 | 1.35% | 88 730.02 | 15 623.98 | 17.61% |
| 31.10.2019 | 102 965.62 | 102 272.08 | 693.54 | 0.68% | 87 196.52 | 15 769.10 | 18.08% |
| 30.09.2019 | 102 272.08 | 100 444.41 | 1 827.66 | 1.82% | 86 161.49 | 16 110.59 | 18.70% |
| 31.08.2019 | 100 444.41 | 99 639.17 | 805.24 | 0.81% | 85 245.76 | 15 198.66 | 17.83% |
| 31.07.2019 | 99 639.17 | 98 323.81 | 1 315.36 | 1.34% | 84 340.86 | 15 298.31 | 18.14% |
| 30.06.2019 | 98 323.81 | 98 211.39 | 112.42 | 0.11% | 83 064.35 | 15 259.47 | 18.37% |
| 31.05.2019 | 98 211.39 | 97 605.02 | 606.37 | 0.62% | 81 689.69 | 16 521.70 | 20.22% |
| 30.04.2019 | 97 605.02 | 96 030.92 | 1 574.10 | 1.64% | 80 680.18 | 16 924.84 | 20.98% |
| 31.03.2019 | 96 030.92 | 94 324.99 | 1 705.93 | 1.81% | 80 199.41 | 15 831.51 | 19.74% |
| 28.02.2019 | 94 324.99 | 93 170.60 | 1 154.39 | 1.24% | 79 670.44 | 14 654.55 | 18.39% |
| 31.01.2019 | 93 170.60 | 91 773.40 | 1 397.20 | 1.52% | 78 835.94 | 14 334.66 | 18.18% |
| 31.12.2018 | 91 773.40 | 88 730.02 | 3 043.38 | 3.43% | 78 404.67 | 13 368.73 | 17.05% |
| 30.11.2018 | 88 730.02 | 87 196.52 | 1 533.51 | 1.76% | 73 834.43 | 14 895.60 | 20.17% |
| 31.10.2018 | 87 196.52 | 86 161.49 | 1 035.03 | 1.20% | 73 239.02 | 13 957.50 | 19.06% |
| 30.09.2018 | 86 161.49 | 85 245.76 | 915.74 | 1.07% | 72 641.56 | 13 519.93 | 18.61% |
| 31.08.2018 | 85 245.76 | 84 340.86 | 904.89 | 1.07% | 71 732.89 | 13 512.86 | 18.84% |
| 31.07.2018 | 84 340.86 | 83 064.35 | 1 276.52 | 1.54% | 70 930.87 | 13 410.00 | 18.91% |
| 30.06.2018 | 83 064.35 | 81 689.69 | 1 374.66 | 1.68% | 70 550.05 | 12 514.30 | 17.74% |
| 31.05.2018 | 81 689.69 | 80 680.18 | 1 009.51 | 1.25% | 68 918.88 | 12 770.81 | 18.53% |
| 30.04.2018 | 80 680.18 | 80 199.41 | 480.77 | 0.60% | 68 725.28 | 11 954.90 | 17.40% |
| 31.03.2018 | 80 199.41 | 79 670.44 | 528.97 | 0.66% | 67 674.40 | 12 525.01 | 18.51% |
| 28.02.2018 | 79 670.44 | 78 835.94 | 834.50 | 1.06% | 66 615.81 | 13 054.63 | 19.60% |
| 31.01.2018 | 78 835.94 | 78 404.67 | 431.27 | 0.55% | 65 754.74 | 13 081.21 | 19.89% |
| 31.12.2017 | 78 404.67 | 73 834.43 | 4 570.24 | 6.19% | 68 698.42 | 9 706.25 | 14.13% |
| 30.11.2017 | 73 834.43 | 73 239.02 | 595.41 | 0.81% | 65 170.03 | 8 664.40 | 13.29% |
| 31.10.2017 | 73 239.02 | 72 641.56 | 597.46 | 0.82% | 63 821.27 | 9 417.75 | 14.76% |
| 30.09.2017 | 72 641.56 | 71 732.89 | 908.67 | 1.27% | 63 699.94 | 8 941.62 | 14.04% |
| 31.08.2017 | 71 732.89 | 70 930.87 | 802.03 | 1.13% | 60 990.43 | 10 742.47 | 17.61% |
| 31.07.2017 | 70 930.87 | 70 550.05 | 380.82 | 0.54% | 60 059.92 | 10 870.95 | 18.10% |
| 30.06.2017 | 70 550.05 | 68 918.88 | 1 631.17 | 2.37% | 58 783.01 | 11 767.04 | 20.02% |
| 31.05.2017 | 68 918.88 | 68 725.28 | 193.59 | 0.28% | 60 243.57 | 8 675.31 | 14.40% |
| 30.04.2017 | 68 725.28 | 67 674.40 | 1 050.88 | 1.55% | 59 204.76 | 9 520.53 | 16.08% |
| 31.03.2017 | 67 674.40 | 66 615.81 | 1 058.59 | 1.59% | 58 660.97 | 9 013.44 | 15.37% |
| 28.02.2017 | 66 615.81 | 65 754.74 | 861.08 | 1.31% | 59 289.57 | 7 326.25 | 12.36% |
| 31.01.2017 | 65 754.74 | 68 698.42 | -2 943.68 | -4.28% | 58 574.46 | 7 180.28 | 12.26% |
| 31.12.2016 | 68 698.42 | 65 170.03 | 3 528.40 | 5.41% | 59 654.32 | 9 044.10 | 15.16% |
| 30.11.2016 | 65 170.03 | 63 821.27 | 1 348.76 | 2.11% | 57 511.39 | 7 658.63 | 13.32% |
| 31.10.2016 | 63 821.27 | 63 699.94 | 121.33 | 0.19% | 56 499.47 | 7 321.80 | 12.96% |
| 30.09.2016 | 63 699.94 | 60 990.43 | 2 709.51 | 4.44% | 54 819.31 | 8 880.63 | 16.20% |
| 31.08.2016 | 60 990.43 | 60 059.92 | 930.51 | 1.55% | 54 304.84 | 6 685.59 | 12.31% |
| 31.07.2016 | 60 059.92 | 58 783.01 | 1 276.91 | 2.17% | 53 204.96 | 6 854.96 | 12.88% |
| 30.06.2016 | 58 783.01 | 60 243.57 | -1 460.56 | -2.42% | 52 371.44 | 6 411.56 | 12.24% |
| 31.05.2016 | 60 243.57 | 59 204.76 | 1 038.82 | 1.75% | 54 412.81 | 5 830.76 | 10.72% |
| 30.04.2016 | 59 204.76 | 58 660.97 | 543.79 | 0.93% | 53 950.82 | 5 253.93 | 9.74% |
| 31.03.2016 | 58 660.97 | 59 289.57 | - 628.60 | -1.06% | 53 595.77 | 5 065.19 | 9.45% |
| 29.02.2016 | 59 289.57 | 58 574.46 | 715.11 | 1.22% | 52 156.63 | 7 132.93 | 13.68% |
| 31.01.2016 | 58 574.46 | 59 654.32 | -1 079.86 | -1.81% | 52 245.78 | 6 328.67 | 12.11% |
| 31.12.2015 | 59 654.32 | 57 511.39 | 2 142.93 | 3.73% | 57 126.71 | 2 527.60 | 4.42% |
| 30.11.2015 | 57 511.39 | 56 499.47 | 1 011.92 | 1.79% | 57 496.41 | 14.98 | 0.03% |
| 31.10.2015 | 56 499.47 | 54 819.31 | 1 680.16 | 3.06% | 56 244.48 | 254.99 | 0.45% |
| 30.09.2015 | 54 819.31 | 54 304.84 | 514.47 | 0.95% | 53 574.46 | 1 244.86 | 2.32% |
| 31.08.2015 | 54 304.84 | 53 204.96 | 1 099.88 | 2.07% | 53 228.66 | 1 076.18 | 2.02% |
| 31.07.2015 | 53 204.96 | 52 371.44 | 833.51 | 1.59% | 52 626.15 | 578.80 | 1.10% |
| 30.06.2015 | 52 371.44 | 54 412.81 | -2 041.37 | -3.75% | 52 505.18 | - 133.74 | -0.25% |
| 31.05.2015 | 54 412.81 | 53 950.82 | 461.98 | 0.86% | 52 988.35 | 1 424.46 | 2.69% |
| 30.04.2015 | 53 950.82 | 53 595.77 | 355.05 | 0.66% | 53 422.32 | 528.50 | 0.99% |
| 31.03.2015 | 53 595.77 | 52 156.63 | 1 439.14 | 2.76% | 52 691.14 | 904.63 | 1.72% |
| 28.02.2015 | 52 156.63 | 52 245.78 | -89.15 | -0.17% | 52 338.06 | - 181.43 | -0.35% |
| 31.01.2015 | 52 245.78 | 57 126.71 | -4 880.93 | -8.54% | 51 969.72 | 276.06 | 0.53% |
| 31.12.2014 | 57 126.71 | 57 496.41 | - 369.69 | -0.64% | 51 565.24 | 5 561.47 | 10.79% |
| 30.11.2014 | 57 496.41 | 56 244.48 | 1 251.93 | 2.23% | 52 119.29 | 5 377.12 | 10.32% |
| 31.10.2014 | 56 244.48 | 53 574.46 | 2 670.02 | 4.98% | 51 735.21 | 4 509.27 | 8.72% |
| 30.09.2014 | 53 574.46 | 53 228.66 | 345.80 | 0.65% | 51 541.08 | 2 033.37 | 3.95% |
| 31.08.2014 | 53 228.66 | 52 626.15 | 602.50 | 1.14% | 50 680.67 | 2 547.98 | 5.03% |
| 31.07.2014 | 52 626.15 | 52 505.18 | 120.97 | 0.23% | 49 856.93 | 2 769.23 | 5.55% |
| 30.06.2014 | 52 505.18 | 52 988.35 | - 483.17 | -0.91% | 49 401.97 | 3 103.21 | 6.28% |
| 31.05.2014 | 52 988.35 | 53 422.32 | - 433.97 | -0.81% | 48 521.38 | 4 466.97 | 9.21% |
| 30.04.2014 | 53 422.32 | 52 691.14 | 731.18 | 1.39% | 48 019.49 | 5 402.84 | 11.25% |
| 31.03.2014 | 52 691.14 | 52 338.06 | 353.08 | 0.67% | 38 148.03 | 14 543.11 | 38.12% |
| 28.02.2014 | 52 338.06 | 51 969.72 | 368.34 | 0.71% | 36 043.54 | 16 294.53 | 45.21% |
| 31.01.2014 | 51 969.72 | 51 565.24 | 404.48 | 0.78% | 35 670.12 | 16 299.61 | 45.70% |
| 31.12.2013 | 51 565.24 | 52 119.29 | - 554.05 | -1.06% | 35 474.33 | 16 090.91 | 45.36% |
| 30.11.2013 | 52 119.29 | 51 735.21 | 384.08 | 0.74% | 34 007.73 | 18 111.56 | 53.26% |
| 31.10.2013 | 51 735.21 | 51 541.08 | 194.12 | 0.38% | 24 161.18 | 27 574.03 | 114.13% |
| 30.09.2013 | 51 541.08 | 50 680.67 | 860.41 | 1.70% | 24 778.77 | 26 762.31 | 108.00% |
| 31.08.2013 | 50 680.67 | 49 856.93 | 823.75 | 1.65% | 24 223.12 | 26 457.56 | 109.22% |
| 31.07.2013 | 49 856.93 | 49 401.97 | 454.95 | 0.92% | 21 593.12 | 28 263.80 | 130.89% |
| 30.06.2013 | 49 401.97 | 48 521.38 | 880.60 | 1.81% | 21 302.87 | 28 099.10 | 131.90% |
| 31.05.2013 | 48 521.38 | 48 019.49 | 501.89 | 1.05% | 21 126.44 | 27 394.93 | 129.67% |
| 30.04.2013 | 48 019.49 | 38 148.03 | 9 871.46 | 25.88% | 21 070.83 | 26 948.66 | 127.90% |
| 31.03.2013 | 38 148.03 | 36 043.54 | 2 104.49 | 5.84% | 21 018.53 | 17 129.50 | 81.50% |
| 28.02.2013 | 36 043.54 | 35 670.12 | 373.42 | 1.05% | 20 173.15 | 15 870.38 | 78.67% |
| 31.01.2013 | 35 670.12 | 35 474.33 | 195.79 | 0.55% | 19 826.44 | 15 843.67 | 79.91% |
| 31.12.2012 | 35 474.33 | 34 007.73 | 1 466.59 | 4.31% | 18 932.43 | 16 541.90 | 87.37% |
| 30.11.2012 | 34 007.73 | 24 161.18 | 9 846.55 | 40.75% | 18 931.58 | 15 076.15 | 79.63% |
| 31.10.2012 | 24 161.18 | 24 778.77 | - 617.60 | -2.49% | 18 854.27 | 5 306.91 | 28.15% |
| 30.09.2012 | 24 778.77 | 24 223.12 | 555.66 | 2.29% | 18 511.71 | 6 267.06 | 33.85% |
| 31.08.2012 | 24 223.12 | 21 593.12 | 2 629.99 | 12.18% | 17 804.99 | 6 418.13 | 36.05% |
| 31.07.2012 | 21 593.12 | 21 302.87 | 290.26 | 1.36% | 16 317.67 | 5 275.46 | 32.33% |
| 30.06.2012 | 21 302.87 | 21 126.44 | 176.42 | 0.83% | 15 277.07 | 6 025.79 | 39.44% |
| 31.05.2012 | 21 126.44 | 21 070.83 | 55.62 | 0.26% | 14 444.25 | 6 682.19 | 46.26% |
| 30.04.2012 | 21 070.83 | 21 018.53 | 52.30 | 0.25% | 13 716.76 | 7 354.07 | 53.61% |
| 31.03.2012 | 21 018.53 | 20 173.15 | 845.38 | 4.19% | 13 546.60 | 7 471.93 | 55.16% |
| 29.02.2012 | 20 173.15 | 19 826.44 | 346.71 | 1.75% | 13 400.99 | 6 772.16 | 50.53% |
| 31.01.2012 | 19 826.44 | 18 932.43 | 894.01 | 4.72% | 12 832.69 | 6 993.75 | 54.50% |
| 31.12.2011 | 18 932.43 | 18 931.58 | 0.85 | 0.00% | 12 645.15 | 6 287.28 | 49.72% |
| 30.11.2011 | 18 931.58 | 18 854.27 | 77.31 | 0.41% | 11 803.80 | 7 127.78 | 60.39% |
| 31.10.2011 | 18 854.27 | 18 511.71 | 342.56 | 1.85% | 11 633.94 | 7 220.33 | 62.06% |
| 30.09.2011 | 18 511.71 | 17 804.99 | 706.72 | 3.97% | 10 626.78 | 7 884.93 | 74.20% |
| 31.08.2011 | 17 804.99 | 16 317.67 | 1 487.33 | 9.11% | 10 516.69 | 7 288.30 | 69.30% |
| 31.07.2011 | 16 317.67 | 15 277.07 | 1 040.59 | 6.81% | 8 866.72 | 7 450.94 | 84.03% |
| 30.06.2011 | 15 277.07 | 14 444.25 | 832.82 | 5.77% | 8 822.43 | 6 454.65 | 73.16% |
| 31.05.2011 | 14 444.25 | 13 716.76 | 727.49 | 5.30% | 7 553.87 | 6 890.39 | 91.22% |
| 30.04.2011 | 13 716.76 | 13 546.60 | 170.16 | 1.26% | 7 730.99 | 5 985.76 | 77.43% |
| 31.03.2011 | 13 546.60 | 13 400.99 | 145.61 | 1.09% | 7 500.78 | 6 045.82 | 80.60% |
| 28.02.2011 | 13 400.99 | 12 832.69 | 568.30 | 4.43% | 7 934.77 | 5 466.22 | 68.89% |
| 31.01.2011 | 12 832.69 | 12 645.15 | 187.54 | 1.48% | 7 868.41 | 4 964.28 | 63.09% |
| 31.12.2010 | 12 645.15 | 11 803.80 | 841.35 | 7.13% | 7 779.60 | 4 865.56 | 62.54% |
| 30.11.2010 | 11 803.80 | 11 633.94 | 169.87 | 1.46% | 7 148.92 | 4 654.89 | 65.11% |
| 31.10.2010 | 11 633.94 | 10 626.78 | 1 007.16 | 9.48% | 6 471.07 | 5 162.86 | 79.78% |
| 30.09.2010 | 10 626.78 | 10 516.69 | 110.09 | 1.05% | 6 447.35 | 4 179.43 | 64.82% |
| 31.08.2010 | 10 516.69 | 8 866.72 | 1 649.97 | 18.61% | 5 734.38 | 4 782.31 | 83.40% |
| 31.07.2010 | 8 866.72 | 8 822.43 | 44.30 | 0.50% | 5 650.52 | 3 216.20 | 56.92% |
| 30.06.2010 | 8 822.43 | 7 553.87 | 1 268.56 | 16.79% | 5 614.44 | 3 207.99 | 57.14% |
| 31.05.2010 | 7 553.87 | 7 730.99 | - 177.13 | -2.29% | 5 609.23 | 1 944.64 | 34.67% |
| 30.04.2010 | 7 730.99 | 7 500.78 | 230.22 | 3.07% | 5 593.67 | 2 137.32 | 38.21% |
| 31.03.2010 | 7 500.78 | 7 934.77 | - 434.00 | -5.47% | 5 673.15 | 1 827.63 | 32.22% |
| 28.02.2010 | 7 934.77 | 7 868.41 | 66.36 | 0.84% | 5 689.95 | 2 244.83 | 39.45% |
| 31.01.2010 | 7 868.41 | 7 779.60 | 88.81 | 1.14% | 5 783.10 | 2 085.31 | 36.06% |
| 31.12.2009 | 7 779.60 | 7 148.92 | 630.68 | 8.82% | 5 816.98 | 1 962.61 | 33.74% |
| 30.11.2009 | 7 148.92 | 6 471.07 | 677.84 | 10.47% | - | - | - |
| 31.10.2009 | 6 471.07 | 6 447.35 | 23.73 | 0.37% | - | - | - |
| 30.09.2009 | 6 447.35 | 5 734.38 | 712.97 | 12.43% | - | - | - |
| 31.08.2009 | 5 734.38 | 5 650.52 | 83.85 | 1.48% | - | - | - |
| 31.07.2009 | 5 650.52 | 5 614.44 | 36.09 | 0.64% | - | - | - |
| 30.06.2009 | 5 614.44 | 5 609.23 | 5.21 | 0.09% | - | - | - |
| 31.05.2009 | 5 609.23 | 5 593.67 | 15.56 | 0.28% | - | - | - |
| 30.04.2009 | 5 593.67 | 5 673.15 | -79.47 | -1.40% | - | - | - |
| 31.03.2009 | 5 673.15 | 5 689.95 | -16.80 | -0.30% | - | - | - |
| 28.02.2009 | 5 689.95 | 5 783.10 | -93.15 | -1.61% | - | - | - |
| 31.01.2009 | 5 783.10 | 5 816.98 | -33.88 | -0.58% | - | - | - |
| 31.12.2008 | 5 816.98 | - | - | - | - | - | - |
Graf jako obrázek

Podobné sestavy
Aplikace Ekonomika ČNB ze sekce makroekonomika zobrazuje časové řady hlavních makroekonomických údajů z ekonomiky ČR. Najdete zde přes 10.000 grafů různých hodnot od úrokových sazeb, přes statistiky státního rozpočtu, statistiky ČNB a data zpracovávaná ČSÚ. Data jsou k dispozici obvykle za posledních více než 20 let, od prosince roku 1992. Zdroj dat: ČNB ARAD

