Mutual funds shares/units issued (Real Estate Funds Balance Sheet - Flows) - ekonomika ČNB
Aktualizace dat Mutual funds shares/units issued (Real Estate Funds Balance Sheet - Flows) v této aplikaci skončila 30.6.2023. Aktualizovná data časových řad najdete na stránkách nové aplikace z dat ARAD ČNB
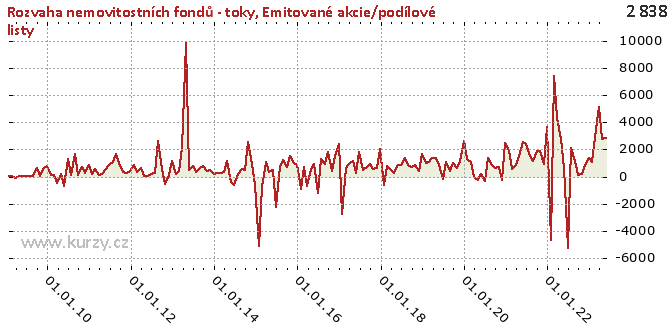
Graf hodnot, Real Estate Funds Balance Sheet - Flows
Meziroční srovnání
Minima a maxima
| Typ | Období | Hodnota |
|---|---|---|
| Min | 31.01.2015 | -5 109.24 |
| Max | 30.04.2013 | 9 869.45 |
Historické hodnoty
| Období | Hodnota | Předchozí | Rozdíl | Změna | Před rokem | Rozdíl | Změna |
|---|---|---|---|---|---|---|---|
| 30.06.2020 | - 661.09 | 208.22 | - 869.31 | - 417.50% | - 188.43 | - 472.66 | 250.85% |
| 31.05.2020 | 208.22 | -1 028.86 | 1 237.07 | - 120.24% | 880.00 | - 671.78 | -76.34% |
| 30.04.2020 | -1 028.86 | 1 343.28 | -2 372.14 | - 176.59% | 1 339.94 | -2 368.80 | - 176.78% |
| 31.03.2020 | 1 343.28 | 1 643.24 | - 299.96 | -18.25% | 1 398.56 | -55.28 | -3.95% |
| 29.02.2020 | 1 643.24 | 1 550.78 | 92.46 | 5.96% | 1 049.60 | 593.64 | 56.56% |
| 31.01.2020 | 1 550.78 | 1 402.46 | 148.32 | 10.58% | 1 029.50 | 521.29 | 50.63% |
| 31.12.2019 | 1 402.46 | 1 173.31 | 229.15 | 19.53% | 1 655.61 | - 253.15 | -15.29% |
| 30.11.2019 | 1 173.31 | 656.46 | 516.86 | 78.73% | 431.85 | 741.46 | 171.69% |
| 31.10.2019 | 656.46 | 981.11 | - 324.65 | -33.09% | 883.31 | - 226.85 | -25.68% |
| 30.09.2019 | 981.11 | 411.11 | 570.00 | 138.65% | 712.61 | 268.50 | 37.68% |
| 31.08.2019 | 411.11 | 1 050.86 | - 639.75 | -60.88% | 864.26 | - 453.15 | -52.43% |
| 31.07.2019 | 1 050.86 | - 188.43 | 1 239.29 | - 657.70% | 1 336.04 | - 285.18 | -21.34% |
| 30.06.2019 | - 188.43 | 880.00 | -1 068.42 | - 121.41% | 835.83 | -1 024.26 | - 122.54% |
| 31.05.2019 | 880.00 | 1 339.94 | - 459.95 | -34.33% | 872.58 | 7.42 | 0.85% |
| 30.04.2019 | 1 339.94 | 1 398.56 | -58.62 | -4.19% | 261.48 | 1 078.47 | 412.45% |
| 31.03.2019 | 1 398.56 | 1 049.60 | 348.96 | 33.25% | 462.93 | 935.64 | 202.11% |
| 28.02.2019 | 1 049.60 | 1 029.50 | 20.10 | 1.95% | 778.95 | 270.65 | 34.74% |
| 31.01.2019 | 1 029.50 | 1 655.61 | - 626.11 | -37.82% | - 590.24 | 1 619.73 | - 274.42% |
| 31.12.2018 | 1 655.61 | 431.85 | 1 223.76 | 283.37% | 2 031.47 | - 375.86 | -18.50% |
| 30.11.2018 | 431.85 | 883.31 | - 451.46 | -51.11% | 603.37 | - 171.52 | -28.43% |
| 31.10.2018 | 883.31 | 712.61 | 170.70 | 23.95% | 572.83 | 310.48 | 54.20% |
| 30.09.2018 | 712.61 | 864.26 | - 151.65 | -17.55% | 955.54 | - 242.93 | -25.42% |
| 31.08.2018 | 864.26 | 1 336.04 | - 471.78 | -35.31% | 738.42 | 125.83 | 17.04% |
| 31.07.2018 | 1 336.04 | 835.83 | 500.21 | 59.85% | 495.54 | 840.50 | 169.61% |
| 30.06.2018 | 835.83 | 872.58 | -36.74 | -4.21% | 1 805.62 | - 969.79 | -53.71% |
| 31.05.2018 | 872.58 | 261.48 | 611.10 | 233.71% | 275.25 | 597.32 | 217.01% |
| 30.04.2018 | 261.48 | 462.93 | - 201.45 | -43.52% | 1 139.02 | - 877.55 | -77.04% |
| 31.03.2018 | 462.93 | 778.95 | - 316.03 | -40.57% | 958.57 | - 495.65 | -51.71% |
| 28.02.2018 | 778.95 | - 590.24 | 1 369.19 | - 231.97% | 633.33 | 145.62 | 22.99% |
| 31.01.2018 | - 590.24 | 2 031.47 | -2 621.70 | - 129.05% | -2 788.84 | 2 198.61 | -78.84% |
| 31.12.2017 | 2 031.47 | 603.37 | 1 428.10 | 236.69% | 2 406.58 | - 375.11 | -15.59% |
| 30.11.2017 | 603.37 | 572.83 | 30.54 | 5.33% | 1 529.60 | - 926.22 | -60.55% |
| 31.10.2017 | 572.83 | 955.54 | - 382.71 | -40.05% | 391.33 | 181.51 | 46.38% |
| 30.09.2017 | 955.54 | 738.42 | 217.12 | 29.40% | 1 818.00 | - 862.46 | -47.44% |
| 31.08.2017 | 738.42 | 495.54 | 242.89 | 49.01% | 904.56 | - 166.14 | -18.37% |
| 31.07.2017 | 495.54 | 1 805.62 | -1 310.08 | -72.56% | 1 295.49 | - 799.95 | -61.75% |
| 30.06.2017 | 1 805.62 | 275.25 | 1 530.37 | 555.98% | -1 219.42 | 3 025.04 | - 248.07% |
| 31.05.2017 | 275.25 | 1 139.02 | - 863.77 | -75.83% | 954.23 | - 678.98 | -71.15% |
| 30.04.2017 | 1 139.02 | 958.57 | 180.45 | 18.82% | 550.48 | 588.54 | 106.91% |
| 31.03.2017 | 958.57 | 633.33 | 325.24 | 51.35% | - 725.47 | 1 684.04 | - 232.13% |
| 28.02.2017 | 633.33 | -2 788.84 | 3 422.17 | - 122.71% | 704.56 | -71.23 | -10.11% |
| 31.01.2017 | -2 788.84 | 2 406.58 | -5 195.42 | - 215.88% | - 947.55 | -1 841.29 | 194.32% |
| 31.12.2016 | 2 406.58 | 1 529.60 | 876.98 | 57.33% | 833.72 | 1 572.86 | 188.66% |
| 30.11.2016 | 1 529.60 | 391.33 | 1 138.27 | 290.87% | 1 009.90 | 519.69 | 51.46% |
| 31.10.2016 | 391.33 | 1 818.00 | -1 426.68 | -78.47% | 1 482.75 | -1 091.42 | -73.61% |
| 30.09.2016 | 1 818.00 | 904.56 | 913.44 | 100.98% | 689.29 | 1 128.71 | 163.75% |
| 31.08.2016 | 904.56 | 1 295.49 | - 390.92 | -30.18% | 1 191.63 | - 287.06 | -24.09% |
| 31.07.2016 | 1 295.49 | -1 219.42 | 2 514.91 | - 206.24% | 727.55 | 567.94 | 78.06% |
| 30.06.2016 | -1 219.42 | 954.23 | -2 173.65 | - 227.79% | -2 213.87 | 994.45 | -44.92% |
| 31.05.2016 | 954.23 | 550.48 | 403.75 | 73.34% | 482.61 | 471.62 | 97.72% |
| 30.04.2016 | 550.48 | - 725.47 | 1 275.95 | - 175.88% | 329.89 | 220.59 | 66.87% |
| 31.03.2016 | - 725.47 | 704.56 | -1 430.03 | - 202.97% | 1 046.28 | -1 771.75 | - 169.34% |
| 29.02.2016 | 704.56 | - 947.55 | 1 652.11 | - 174.36% | - 742.13 | 1 446.69 | - 194.94% |
| 31.01.2016 | - 947.55 | 833.72 | -1 781.27 | - 213.65% | -5 109.24 | 4 161.69 | -81.45% |
| 31.12.2015 | 833.72 | 1 009.90 | - 176.19 | -17.45% | - 634.00 | 1 467.72 | - 231.50% |
| 30.11.2015 | 1 009.90 | 1 482.75 | - 472.84 | -31.89% | 957.41 | 52.50 | 5.48% |
| 31.10.2015 | 1 482.75 | 689.29 | 793.46 | 115.11% | 2 556.95 | -1 074.20 | -42.01% |
| 30.09.2015 | 689.29 | 1 191.63 | - 502.34 | -42.16% | 449.13 | 240.16 | 53.47% |
| 31.08.2015 | 1 191.63 | 727.55 | 464.08 | 63.79% | 587.91 | 603.72 | 102.69% |
| 31.07.2015 | 727.55 | -2 213.87 | 2 941.42 | - 132.86% | 184.91 | 542.64 | 293.47% |
| 30.06.2015 | -2 213.87 | 482.61 | -2 696.48 | - 558.73% | - 604.81 | -1 609.06 | 266.04% |
| 31.05.2015 | 482.61 | 329.89 | 152.72 | 46.29% | - 378.83 | 861.44 | - 227.39% |
| 30.04.2015 | 329.89 | 1 046.28 | - 716.38 | -68.47% | 1 149.04 | - 819.15 | -71.29% |
| 31.03.2015 | 1 046.28 | - 742.13 | 1 788.41 | - 240.98% | 367.49 | 678.79 | 184.71% |
| 28.02.2015 | - 742.13 | -5 109.24 | 4 367.11 | -85.47% | 292.13 | -1 034.26 | - 354.04% |
| 31.01.2015 | -5 109.24 | - 634.00 | -4 475.24 | 705.88% | 255.29 | -5 364.53 | -2 101.36% |
| 31.12.2014 | - 634.00 | 957.41 | -1 591.41 | - 166.22% | 211.07 | - 845.07 | - 400.37% |
| 30.11.2014 | 957.41 | 2 556.95 | -1 599.54 | -62.56% | 484.41 | 473.00 | 97.64% |
| 31.10.2014 | 2 556.95 | 449.13 | 2 107.82 | 469.31% | 383.41 | 2 173.54 | 566.90% |
| 30.09.2014 | 449.13 | 587.91 | - 138.78 | -23.61% | 794.76 | - 345.62 | -43.49% |
| 31.08.2014 | 587.91 | 184.91 | 403.00 | 217.95% | 653.65 | -65.75 | -10.06% |
| 31.07.2014 | 184.91 | - 604.81 | 789.72 | - 130.57% | 346.17 | - 161.26 | -46.58% |
| 30.06.2014 | - 604.81 | - 378.83 | - 225.98 | 59.65% | 759.22 | -1 364.04 | - 179.66% |
| 31.05.2014 | - 378.83 | 1 149.04 | -1 527.87 | - 132.97% | 503.32 | - 882.15 | - 175.27% |
| 30.04.2014 | 1 149.04 | 367.49 | 781.55 | 212.67% | 9 869.45 | -8 720.41 | -88.36% |
| 31.03.2014 | 367.49 | 292.13 | 75.36 | 25.80% | 2 117.33 | -1 749.84 | -82.64% |
| 28.02.2014 | 292.13 | 255.29 | 36.85 | 14.43% | 379.18 | -87.04 | -22.96% |
| 31.01.2014 | 255.29 | 211.07 | 44.21 | 20.95% | 202.17 | 53.12 | 26.28% |
| 31.12.2013 | 211.07 | 484.41 | - 273.34 | -56.43% | 1 178.03 | - 966.95 | -82.08% |
| 30.11.2013 | 484.41 | 383.41 | 101.00 | 26.34% | 149.95 | 334.46 | 223.04% |
| 31.10.2013 | 383.41 | 794.76 | - 411.35 | -51.76% | - 537.31 | 920.72 | - 171.36% |
| 30.09.2013 | 794.76 | 653.65 | 141.10 | 21.59% | 566.04 | 228.71 | 40.41% |
| 31.08.2013 | 653.65 | 346.17 | 307.49 | 88.83% | 2 610.56 | -1 956.91 | -74.96% |
| 31.07.2013 | 346.17 | 759.22 | - 413.05 | -54.40% | 268.76 | 77.41 | 28.80% |
| 30.06.2013 | 759.22 | 503.32 | 255.90 | 50.84% | 161.67 | 597.55 | 369.62% |
| 31.05.2013 | 503.32 | 9 869.45 | -9 366.13 | -94.90% | 70.99 | 432.33 | 609.01% |
| 30.04.2013 | 9 869.45 | 2 117.33 | 7 752.12 | 366.13% | 71.25 | 9 798.19 | 13 750.88% |
| 31.03.2013 | 2 117.33 | 379.18 | 1 738.15 | 458.40% | 608.25 | 1 509.08 | 248.10% |
| 28.02.2013 | 379.18 | 202.17 | 177.01 | 87.56% | 315.37 | 63.80 | 20.23% |
| 31.01.2013 | 202.17 | 1 178.03 | - 975.86 | -82.84% | 854.77 | - 652.60 | -76.35% |
| 31.12.2012 | 1 178.03 | 149.95 | 1 028.07 | 685.59% | 432.09 | 745.93 | 172.63% |
| 30.11.2012 | 149.95 | - 537.31 | 687.26 | - 127.91% | 274.96 | - 125.01 | -45.46% |
| 31.10.2012 | - 537.31 | 566.04 | -1 103.35 | - 194.92% | 329.95 | - 867.26 | - 262.84% |
| 30.09.2012 | 566.04 | 2 610.56 | -2 044.52 | -78.32% | 801.91 | - 235.87 | -29.41% |
| 31.08.2012 | 2 610.56 | 268.76 | 2 341.80 | 871.34% | 1 663.06 | 947.50 | 56.97% |
| 31.07.2012 | 268.76 | 161.67 | 107.09 | 66.24% | 1 040.10 | - 771.34 | -74.16% |
| 30.06.2012 | 161.67 | 70.99 | 90.68 | 127.73% | 815.54 | - 653.87 | -80.18% |
| 31.05.2012 | 70.99 | 71.25 | -0.27 | -0.37% | 583.08 | - 512.09 | -87.83% |
| 30.04.2012 | 71.25 | 608.25 | - 537.00 | -88.29% | 152.50 | -81.24 | -53.27% |
| 31.03.2012 | 608.25 | 315.37 | 292.88 | 92.87% | 141.35 | 466.89 | 330.30% |
| 29.02.2012 | 315.37 | 854.77 | - 539.39 | -63.10% | 562.63 | - 247.26 | -43.95% |
| 31.01.2012 | 854.77 | 432.09 | 422.67 | 97.82% | 171.19 | 683.57 | 399.30% |
| 31.12.2011 | 432.09 | 274.96 | 157.13 | 57.15% | 827.91 | - 395.82 | -47.81% |
| 30.11.2011 | 274.96 | 329.95 | -54.99 | -16.67% | 248.55 | 26.41 | 10.63% |
| 31.10.2011 | 329.95 | 801.91 | - 471.96 | -58.85% | 727.46 | - 397.51 | -54.64% |
| 30.09.2011 | 801.91 | 1 663.06 | - 861.14 | -51.78% | 78.79 | 723.13 | 917.82% |
| 31.08.2011 | 1 663.06 | 1 040.10 | 622.96 | 59.89% | 1 677.41 | -14.35 | -0.86% |
| 31.07.2011 | 1 040.10 | 815.54 | 224.56 | 27.54% | 92.56 | 947.53 | 1 023.64% |
| 30.06.2011 | 815.54 | 583.08 | 232.46 | 39.87% | 1 298.17 | - 482.64 | -37.18% |
| 31.05.2011 | 583.08 | 152.50 | 430.58 | 282.35% | - 706.04 | 1 289.12 | - 182.58% |
| 30.04.2011 | 152.50 | 141.35 | 11.14 | 7.88% | 220.52 | -68.02 | -30.85% |
| 31.03.2011 | 141.35 | 562.63 | - 421.28 | -74.88% | - 488.56 | 629.91 | - 128.93% |
| 28.02.2011 | 562.63 | 171.19 | 391.44 | 228.65% | 80.20 | 482.43 | 601.54% |
| 31.01.2011 | 171.19 | 827.91 | - 656.72 | -79.32% | 94.53 | 76.67 | 81.11% |
| 31.12.2010 | 827.91 | 248.55 | 579.36 | 233.09% | 741.71 | 86.21 | 11.62% |
| 30.11.2010 | 248.55 | 727.46 | - 478.91 | -65.83% | 638.13 | - 389.58 | -61.05% |
| 31.10.2010 | 727.46 | 78.79 | 648.67 | 823.32% | 36.90 | 690.56 | 1 871.60% |
| 30.09.2010 | 78.79 | 1 677.41 | -1 598.62 | -95.30% | 640.58 | - 561.80 | -87.70% |
| 31.08.2010 | 1 677.41 | 92.56 | 1 584.85 | 1 712.14% | 38.31 | 1 639.10 | 4 278.17% |
| 31.07.2010 | 92.56 | 1 298.17 | -1 205.61 | -92.87% | 4.30 | 88.27 | 2 053.68% |
| 30.06.2010 | 1 298.17 | - 706.04 | 2 004.22 | - 283.87% | 20.94 | 1 277.23 | 6 098.90% |
| 31.05.2010 | - 706.04 | 220.52 | - 926.57 | - 420.17% | 17.24 | - 723.29 | -4 194.44% |
| 30.04.2010 | 220.52 | - 488.56 | 709.08 | - 145.14% | 32.35 | 188.17 | 581.63% |
| 31.03.2010 | - 488.56 | 80.20 | - 568.76 | - 709.17% | - 120.80 | - 367.75 | 304.43% |
| 28.02.2010 | 80.20 | 94.53 | -14.32 | -15.15% | 19.13 | 61.07 | 319.28% |
| 31.01.2010 | 94.53 | 741.71 | - 647.18 | -87.26% | 45.23 | 49.29 | 108.97% |
| 31.12.2009 | 741.71 | 638.13 | 103.57 | 16.23% | - | - | - |
| 30.11.2009 | 638.13 | 36.90 | 601.24 | 1 629.50% | - | - | - |
| 31.10.2009 | 36.90 | 640.58 | - 603.69 | -94.24% | - | - | - |
| 30.09.2009 | 640.58 | 38.31 | 602.27 | 1 571.97% | - | - | - |
| 31.08.2009 | 38.31 | 4.30 | 34.02 | 791.41% | - | - | - |
| 31.07.2009 | 4.30 | 20.94 | -16.64 | -79.48% | - | - | - |
| 30.06.2009 | 20.94 | 17.24 | 3.70 | 21.45% | - | - | - |
| 31.05.2009 | 17.24 | 32.35 | -15.11 | -46.70% | - | - | - |
| 30.04.2009 | 32.35 | - 120.80 | 153.15 | - 126.78% | - | - | - |
| 31.03.2009 | - 120.80 | 19.13 | - 139.93 | - 731.54% | - | - | - |
| 28.02.2009 | 19.13 | 45.23 | -26.11 | -57.71% | - | - | - |
| 31.01.2009 | 45.23 | - | - | - | - | - | - |
Graf jako obrázek

Podobné sestavy
Aplikace Ekonomika ČNB ze sekce makroekonomika zobrazuje časové řady hlavních makroekonomických údajů z ekonomiky ČR. Najdete zde přes 10.000 grafů různých hodnot od úrokových sazeb, přes statistiky státního rozpočtu, statistiky ČNB a data zpracovávaná ČSÚ. Data jsou k dispozici obvykle za posledních více než 20 let, od prosince roku 1992. Zdroj dat: ČNB ARAD

