Investment fund shares/units (Equity Funds Balance Sheet) - ekonomika ČNB
Aktualizace dat Investment fund shares/units (Equity Funds Balance Sheet) v této aplikaci skončila 30.6.2023. Aktualizovná data časových řad najdete na stránkách nové aplikace z dat ARAD ČNB
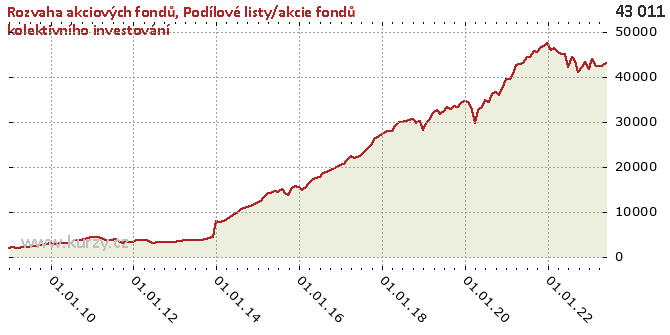
Graf hodnot, Equity Funds Balance Sheet
Meziroční srovnání
Minima a maxima
| Typ | Období | Hodnota |
|---|---|---|
| Max | 30.06.2020 | 34 715.31 |
| Min | 28.02.2009 | 1 902.75 |
Historické hodnoty
| Období | Hodnota | Předchozí | Rozdíl | Změna | Před rokem | Rozdíl | Změna |
|---|---|---|---|---|---|---|---|
| 30.06.2020 | 34 715.31 | 33 312.02 | 1 403.29 | 4.21% | 32 311.78 | 2 403.53 | 7.44% |
| 31.05.2020 | 33 312.02 | 32 677.93 | 634.09 | 1.94% | 31 669.95 | 1 642.07 | 5.18% |
| 30.04.2020 | 32 677.93 | 29 689.31 | 2 988.62 | 10.07% | 32 525.24 | 152.69 | 0.47% |
| 31.03.2020 | 29 689.31 | 33 348.63 | -3 659.33 | -10.97% | 31 899.22 | -2 209.91 | -6.93% |
| 29.02.2020 | 33 348.63 | 34 508.53 | -1 159.90 | -3.36% | 30 676.12 | 2 672.52 | 8.71% |
| 31.01.2020 | 34 508.53 | 34 625.82 | - 117.29 | -0.34% | 29 854.52 | 4 654.02 | 15.59% |
| 31.12.2019 | 34 625.82 | 34 145.51 | 480.31 | 1.41% | 28 216.65 | 6 409.17 | 22.71% |
| 30.11.2019 | 34 145.51 | 33 262.23 | 883.29 | 2.66% | 30 259.77 | 3 885.75 | 12.84% |
| 31.10.2019 | 33 262.23 | 33 430.03 | - 167.80 | -0.50% | 29 754.49 | 3 507.73 | 11.79% |
| 30.09.2019 | 33 430.03 | 32 917.08 | 512.95 | 1.56% | 30 598.09 | 2 831.94 | 9.26% |
| 31.08.2019 | 32 917.08 | 33 294.70 | - 377.62 | -1.13% | 30 484.19 | 2 432.89 | 7.98% |
| 31.07.2019 | 33 294.70 | 32 311.78 | 982.92 | 3.04% | 30 222.47 | 3 072.23 | 10.17% |
| 30.06.2019 | 32 311.78 | 31 669.95 | 641.83 | 2.03% | 29 941.49 | 2 370.28 | 7.92% |
| 31.05.2019 | 31 669.95 | 32 525.24 | - 855.29 | -2.63% | 29 923.19 | 1 746.76 | 5.84% |
| 30.04.2019 | 32 525.24 | 31 899.22 | 626.02 | 1.96% | 29 034.02 | 3 491.22 | 12.02% |
| 31.03.2019 | 31 899.22 | 30 676.12 | 1 223.10 | 3.99% | 27 867.29 | 4 031.93 | 14.47% |
| 28.02.2019 | 30 676.12 | 29 854.52 | 821.60 | 2.75% | 27 923.04 | 2 753.07 | 9.86% |
| 31.01.2019 | 29 854.52 | 28 216.65 | 1 637.87 | 5.80% | 27 824.87 | 2 029.65 | 7.29% |
| 31.12.2018 | 28 216.65 | 30 259.77 | -2 043.12 | -6.75% | 27 355.35 | 861.29 | 3.15% |
| 30.11.2018 | 30 259.77 | 29 754.49 | 505.27 | 1.70% | 26 586.10 | 3 673.66 | 13.82% |
| 31.10.2018 | 29 754.49 | 30 598.09 | - 843.60 | -2.76% | 26 334.54 | 3 419.95 | 12.99% |
| 30.09.2018 | 30 598.09 | 30 484.19 | 113.90 | 0.37% | 24 792.97 | 5 805.12 | 23.41% |
| 31.08.2018 | 30 484.19 | 30 222.47 | 261.72 | 0.87% | 24 209.84 | 6 274.35 | 25.92% |
| 31.07.2018 | 30 222.47 | 29 941.49 | 280.97 | 0.94% | 23 410.65 | 6 811.81 | 29.10% |
| 30.06.2018 | 29 941.49 | 29 923.19 | 18.31 | 0.06% | 22 743.60 | 7 197.89 | 31.65% |
| 31.05.2018 | 29 923.19 | 29 034.02 | 889.17 | 3.06% | 22 094.17 | 7 829.02 | 35.43% |
| 30.04.2018 | 29 034.02 | 27 867.29 | 1 166.72 | 4.19% | 21 990.90 | 7 043.11 | 32.03% |
| 31.03.2018 | 27 867.29 | 27 923.04 | -55.75 | -0.20% | 22 369.89 | 5 497.40 | 24.57% |
| 28.02.2018 | 27 923.04 | 27 824.87 | 98.17 | 0.35% | 21 637.65 | 6 285.39 | 29.05% |
| 31.01.2018 | 27 824.87 | 27 355.35 | 469.51 | 1.72% | 20 736.49 | 7 088.38 | 34.18% |
| 31.12.2017 | 27 355.35 | 26 586.10 | 769.25 | 2.89% | 20 491.38 | 6 863.97 | 33.50% |
| 30.11.2017 | 26 586.10 | 26 334.54 | 251.57 | 0.96% | 19 942.33 | 6 643.77 | 33.31% |
| 31.10.2017 | 26 334.54 | 24 792.97 | 1 541.57 | 6.22% | 19 485.13 | 6 849.41 | 35.15% |
| 30.09.2017 | 24 792.97 | 24 209.84 | 583.12 | 2.41% | 19 226.07 | 5 566.89 | 28.95% |
| 31.08.2017 | 24 209.84 | 23 410.65 | 799.19 | 3.41% | 18 779.39 | 5 430.45 | 28.92% |
| 31.07.2017 | 23 410.65 | 22 743.60 | 667.05 | 2.93% | 18 596.87 | 4 813.79 | 25.88% |
| 30.06.2017 | 22 743.60 | 22 094.17 | 649.43 | 2.94% | 17 861.92 | 4 881.68 | 27.33% |
| 31.05.2017 | 22 094.17 | 21 990.90 | 103.27 | 0.47% | 17 526.08 | 4 568.09 | 26.06% |
| 30.04.2017 | 21 990.90 | 22 369.89 | - 378.99 | -1.69% | 17 232.54 | 4 758.36 | 27.61% |
| 31.03.2017 | 22 369.89 | 21 637.65 | 732.24 | 3.38% | 16 458.23 | 5 911.66 | 35.92% |
| 28.02.2017 | 21 637.65 | 20 736.49 | 901.15 | 4.35% | 15 440.59 | 6 197.05 | 40.13% |
| 31.01.2017 | 20 736.49 | 20 491.38 | 245.11 | 1.20% | 14 866.17 | 5 870.32 | 39.49% |
| 31.12.2016 | 20 491.38 | 19 942.33 | 549.05 | 2.75% | 15 472.88 | 5 018.50 | 32.43% |
| 30.11.2016 | 19 942.33 | 19 485.13 | 457.20 | 2.35% | 15 755.97 | 4 186.36 | 26.57% |
| 31.10.2016 | 19 485.13 | 19 226.07 | 259.06 | 1.35% | 15 240.06 | 4 245.07 | 27.85% |
| 30.09.2016 | 19 226.07 | 18 779.39 | 446.68 | 2.38% | 13 764.75 | 5 461.33 | 39.68% |
| 31.08.2016 | 18 779.39 | 18 596.87 | 182.53 | 0.98% | 14 240.70 | 4 538.69 | 31.87% |
| 31.07.2016 | 18 596.87 | 17 861.92 | 734.94 | 4.11% | 15 073.17 | 3 523.70 | 23.38% |
| 30.06.2016 | 17 861.92 | 17 526.08 | 335.84 | 1.92% | 14 446.50 | 3 415.42 | 23.64% |
| 31.05.2016 | 17 526.08 | 17 232.54 | 293.54 | 1.70% | 14 757.09 | 2 768.99 | 18.76% |
| 30.04.2016 | 17 232.54 | 16 458.23 | 774.31 | 4.70% | 14 232.63 | 2 999.91 | 21.08% |
| 31.03.2016 | 16 458.23 | 15 440.59 | 1 017.63 | 6.59% | 14 218.74 | 2 239.49 | 15.75% |
| 29.02.2016 | 15 440.59 | 14 866.17 | 574.42 | 3.86% | 13 286.77 | 2 153.83 | 16.21% |
| 31.01.2016 | 14 866.17 | 15 472.88 | - 606.71 | -3.92% | 12 495.78 | 2 370.39 | 18.97% |
| 31.12.2015 | 15 472.88 | 15 755.97 | - 283.08 | -1.80% | 11 924.51 | 3 548.38 | 29.76% |
| 30.11.2015 | 15 755.97 | 15 240.06 | 515.91 | 3.39% | 11 698.74 | 4 057.23 | 34.68% |
| 31.10.2015 | 15 240.06 | 13 764.75 | 1 475.31 | 10.72% | 11 363.87 | 3 876.19 | 34.11% |
| 30.09.2015 | 13 764.75 | 14 240.70 | - 475.96 | -3.34% | 10 997.81 | 2 766.93 | 25.16% |
| 31.08.2015 | 14 240.70 | 15 073.17 | - 832.47 | -5.52% | 10 859.62 | 3 381.09 | 31.13% |
| 31.07.2015 | 15 073.17 | 14 446.50 | 626.67 | 4.34% | 10 348.86 | 4 724.31 | 45.65% |
| 30.06.2015 | 14 446.50 | 14 757.09 | - 310.59 | -2.10% | 9 726.34 | 4 720.16 | 48.53% |
| 31.05.2015 | 14 757.09 | 14 232.63 | 524.46 | 3.68% | 9 423.13 | 5 333.97 | 56.60% |
| 30.04.2015 | 14 232.63 | 14 218.74 | 13.89 | 0.10% | 8 884.43 | 5 348.20 | 60.20% |
| 31.03.2015 | 14 218.74 | 13 286.77 | 931.98 | 7.01% | 8 271.70 | 5 947.04 | 71.90% |
| 28.02.2015 | 13 286.77 | 12 495.78 | 790.99 | 6.33% | 8 027.82 | 5 258.95 | 65.51% |
| 31.01.2015 | 12 495.78 | 11 924.51 | 571.27 | 4.79% | 7 740.24 | 4 755.54 | 61.44% |
| 31.12.2014 | 11 924.51 | 11 698.74 | 225.77 | 1.93% | 7 882.40 | 4 042.11 | 51.28% |
| 30.11.2014 | 11 698.74 | 11 363.87 | 334.87 | 2.95% | 4 341.55 | 7 357.19 | 169.46% |
| 31.10.2014 | 11 363.87 | 10 997.81 | 366.06 | 3.33% | 4 140.58 | 7 223.29 | 174.45% |
| 30.09.2014 | 10 997.81 | 10 859.62 | 138.19 | 1.27% | 3 970.14 | 7 027.68 | 177.01% |
| 31.08.2014 | 10 859.62 | 10 348.86 | 510.76 | 4.94% | 3 771.81 | 7 087.81 | 187.92% |
| 31.07.2014 | 10 348.86 | 9 726.34 | 622.52 | 6.40% | 3 839.74 | 6 509.12 | 169.52% |
| 30.06.2014 | 9 726.34 | 9 423.13 | 303.21 | 3.22% | 3 716.39 | 6 009.95 | 161.71% |
| 31.05.2014 | 9 423.13 | 8 884.43 | 538.70 | 6.06% | 3 793.57 | 5 629.56 | 148.40% |
| 30.04.2014 | 8 884.43 | 8 271.70 | 612.73 | 7.41% | 3 673.85 | 5 210.57 | 141.83% |
| 31.03.2014 | 8 271.70 | 8 027.82 | 243.88 | 3.04% | 3 679.97 | 4 591.73 | 124.78% |
| 28.02.2014 | 8 027.82 | 7 740.24 | 287.58 | 3.72% | 3 570.73 | 4 457.09 | 124.82% |
| 31.01.2014 | 7 740.24 | 7 882.40 | - 142.16 | -1.80% | 3 461.64 | 4 278.60 | 123.60% |
| 31.12.2013 | 7 882.40 | 4 341.55 | 3 540.85 | 81.56% | 3 339.00 | 4 543.40 | 136.07% |
| 30.11.2013 | 4 341.55 | 4 140.58 | 200.97 | 4.85% | 3 223.83 | 1 117.72 | 34.67% |
| 31.10.2013 | 4 140.58 | 3 970.14 | 170.44 | 4.29% | 3 368.74 | 771.84 | 22.91% |
| 30.09.2013 | 3 970.14 | 3 771.81 | 198.33 | 5.26% | 3 404.76 | 565.37 | 16.61% |
| 31.08.2013 | 3 771.81 | 3 839.74 | -67.93 | -1.77% | 3 287.38 | 484.43 | 14.74% |
| 31.07.2013 | 3 839.74 | 3 716.39 | 123.35 | 3.32% | 3 237.18 | 602.55 | 18.61% |
| 30.06.2013 | 3 716.39 | 3 793.57 | -77.19 | -2.03% | 3 190.62 | 525.76 | 16.48% |
| 31.05.2013 | 3 793.57 | 3 673.85 | 119.72 | 3.26% | 3 258.29 | 535.28 | 16.43% |
| 30.04.2013 | 3 673.85 | 3 679.97 | -6.12 | -0.17% | 3 731.99 | -58.13 | -1.56% |
| 31.03.2013 | 3 679.97 | 3 570.73 | 109.23 | 3.06% | 3 710.88 | -30.91 | -0.83% |
| 28.02.2013 | 3 570.73 | 3 461.64 | 109.09 | 3.15% | 3 678.74 | - 108.01 | -2.94% |
| 31.01.2013 | 3 461.64 | 3 339.00 | 122.64 | 3.67% | 3 733.41 | - 271.77 | -7.28% |
| 31.12.2012 | 3 339.00 | 3 223.83 | 115.17 | 3.57% | 3 370.60 | -31.60 | -0.94% |
| 30.11.2012 | 3 223.83 | 3 368.74 | - 144.91 | -4.30% | 3 265.47 | -41.65 | -1.28% |
| 31.10.2012 | 3 368.74 | 3 404.76 | -36.02 | -1.06% | 3 449.94 | -81.20 | -2.35% |
| 30.09.2012 | 3 404.76 | 3 287.38 | 117.39 | 3.57% | 3 017.59 | 387.17 | 12.83% |
| 31.08.2012 | 3 287.38 | 3 237.18 | 50.19 | 1.55% | 3 566.37 | - 278.99 | -7.82% |
| 31.07.2012 | 3 237.18 | 3 190.62 | 46.56 | 1.46% | 4 028.85 | - 791.67 | -19.65% |
| 30.06.2012 | 3 190.62 | 3 258.29 | -67.67 | -2.08% | 3 835.78 | - 645.15 | -16.82% |
| 31.05.2012 | 3 258.29 | 3 731.99 | - 473.70 | -12.69% | 3 874.53 | - 616.24 | -15.90% |
| 30.04.2012 | 3 731.99 | 3 710.88 | 21.11 | 0.57% | 3 855.71 | - 123.73 | -3.21% |
| 31.03.2012 | 3 710.88 | 3 678.74 | 32.13 | 0.87% | 4 238.74 | - 527.86 | -12.45% |
| 29.02.2012 | 3 678.74 | 3 733.41 | -54.66 | -1.46% | 4 491.06 | - 812.31 | -18.09% |
| 31.01.2012 | 3 733.41 | 3 370.60 | 362.81 | 10.76% | 4 379.84 | - 646.43 | -14.76% |
| 31.12.2011 | 3 370.60 | 3 265.47 | 105.12 | 3.22% | 4 453.73 | -1 083.13 | -24.32% |
| 30.11.2011 | 3 265.47 | 3 449.94 | - 184.46 | -5.35% | 4 256.02 | - 990.54 | -23.27% |
| 31.10.2011 | 3 449.94 | 3 017.59 | 432.35 | 14.33% | 4 043.03 | - 593.10 | -14.67% |
| 30.09.2011 | 3 017.59 | 3 566.37 | - 548.77 | -15.39% | 3 831.64 | - 814.05 | -21.25% |
| 31.08.2011 | 3 566.37 | 4 028.85 | - 462.48 | -11.48% | 3 752.43 | - 186.06 | -4.96% |
| 31.07.2011 | 4 028.85 | 3 835.78 | 193.07 | 5.03% | 3 791.27 | 237.58 | 6.27% |
| 30.06.2011 | 3 835.78 | 3 874.53 | -38.75 | -1.00% | 3 007.68 | 828.09 | 27.53% |
| 31.05.2011 | 3 874.53 | 3 855.71 | 18.82 | 0.49% | 3 050.45 | 824.08 | 27.01% |
| 30.04.2011 | 3 855.71 | 4 238.74 | - 383.03 | -9.04% | 3 213.80 | 641.91 | 19.97% |
| 31.03.2011 | 4 238.74 | 4 491.06 | - 252.32 | -5.62% | 3 078.57 | 1 160.17 | 37.69% |
| 28.02.2011 | 4 491.06 | 4 379.84 | 111.22 | 2.54% | 2 849.01 | 1 642.05 | 57.64% |
| 31.01.2011 | 4 379.84 | 4 453.73 | -73.89 | -1.66% | 2 939.31 | 1 440.53 | 49.01% |
| 31.12.2010 | 4 453.73 | 4 256.02 | 197.72 | 4.65% | 3 034.26 | 1 419.47 | 46.78% |
| 30.11.2010 | 4 256.02 | 4 043.03 | 212.98 | 5.27% | 2 773.51 | 1 482.51 | 53.45% |
| 31.10.2010 | 4 043.03 | 3 831.64 | 211.39 | 5.52% | 2 739.74 | 1 303.30 | 47.57% |
| 30.09.2010 | 3 831.64 | 3 752.43 | 79.21 | 2.11% | 2 640.34 | 1 191.30 | 45.12% |
| 31.08.2010 | 3 752.43 | 3 791.27 | -38.84 | -1.02% | 2 540.58 | 1 211.85 | 47.70% |
| 31.07.2010 | 3 791.27 | 3 007.68 | 783.59 | 26.05% | 2 358.05 | 1 433.22 | 60.78% |
| 30.06.2010 | 3 007.68 | 3 050.45 | -42.77 | -1.40% | 2 183.11 | 824.57 | 37.77% |
| 31.05.2010 | 3 050.45 | 3 213.80 | - 163.35 | -5.08% | 2 221.98 | 828.48 | 37.29% |
| 30.04.2010 | 3 213.80 | 3 078.57 | 135.24 | 4.39% | 2 126.49 | 1 087.31 | 51.13% |
| 31.03.2010 | 3 078.57 | 2 849.01 | 229.56 | 8.06% | 1 932.23 | 1 146.34 | 59.33% |
| 28.02.2010 | 2 849.01 | 2 939.31 | -90.30 | -3.07% | 1 902.75 | 946.26 | 49.73% |
| 31.01.2010 | 2 939.31 | 3 034.26 | -94.94 | -3.13% | 2 130.87 | 808.44 | 37.94% |
| 31.12.2009 | 3 034.26 | 2 773.51 | 260.75 | 9.40% | 2 084.00 | 950.26 | 45.60% |
| 30.11.2009 | 2 773.51 | 2 739.74 | 33.77 | 1.23% | - | - | - |
| 31.10.2009 | 2 739.74 | 2 640.34 | 99.39 | 3.76% | - | - | - |
| 30.09.2009 | 2 640.34 | 2 540.58 | 99.77 | 3.93% | - | - | - |
| 31.08.2009 | 2 540.58 | 2 358.05 | 182.53 | 7.74% | - | - | - |
| 31.07.2009 | 2 358.05 | 2 183.11 | 174.93 | 8.01% | - | - | - |
| 30.06.2009 | 2 183.11 | 2 221.98 | -38.86 | -1.75% | - | - | - |
| 31.05.2009 | 2 221.98 | 2 126.49 | 95.48 | 4.49% | - | - | - |
| 30.04.2009 | 2 126.49 | 1 932.23 | 194.26 | 10.05% | - | - | - |
| 31.03.2009 | 1 932.23 | 1 902.75 | 29.49 | 1.55% | - | - | - |
| 28.02.2009 | 1 902.75 | 2 130.87 | - 228.13 | -10.71% | - | - | - |
| 31.01.2009 | 2 130.87 | 2 084.00 | 46.88 | 2.25% | - | - | - |
| 31.12.2008 | 2 084.00 | - | - | - | - | - | - |
Graf jako obrázek

Podobné sestavy
Aplikace Ekonomika ČNB ze sekce makroekonomika zobrazuje časové řady hlavních makroekonomických údajů z ekonomiky ČR. Najdete zde přes 10.000 grafů různých hodnot od úrokových sazeb, přes statistiky státního rozpočtu, statistiky ČNB a data zpracovávaná ČSÚ. Data jsou k dispozici obvykle za posledních více než 20 let, od prosince roku 1992. Zdroj dat: ČNB ARAD

